Analytics
The Reports section shows what played on a screen, where, and how often. This page explains each section displayed in the analytics for both screens and files.
Screen Analytics
Screen Analytics answers “what played on this screen?” – every asset that ran on it, over a duration you set.
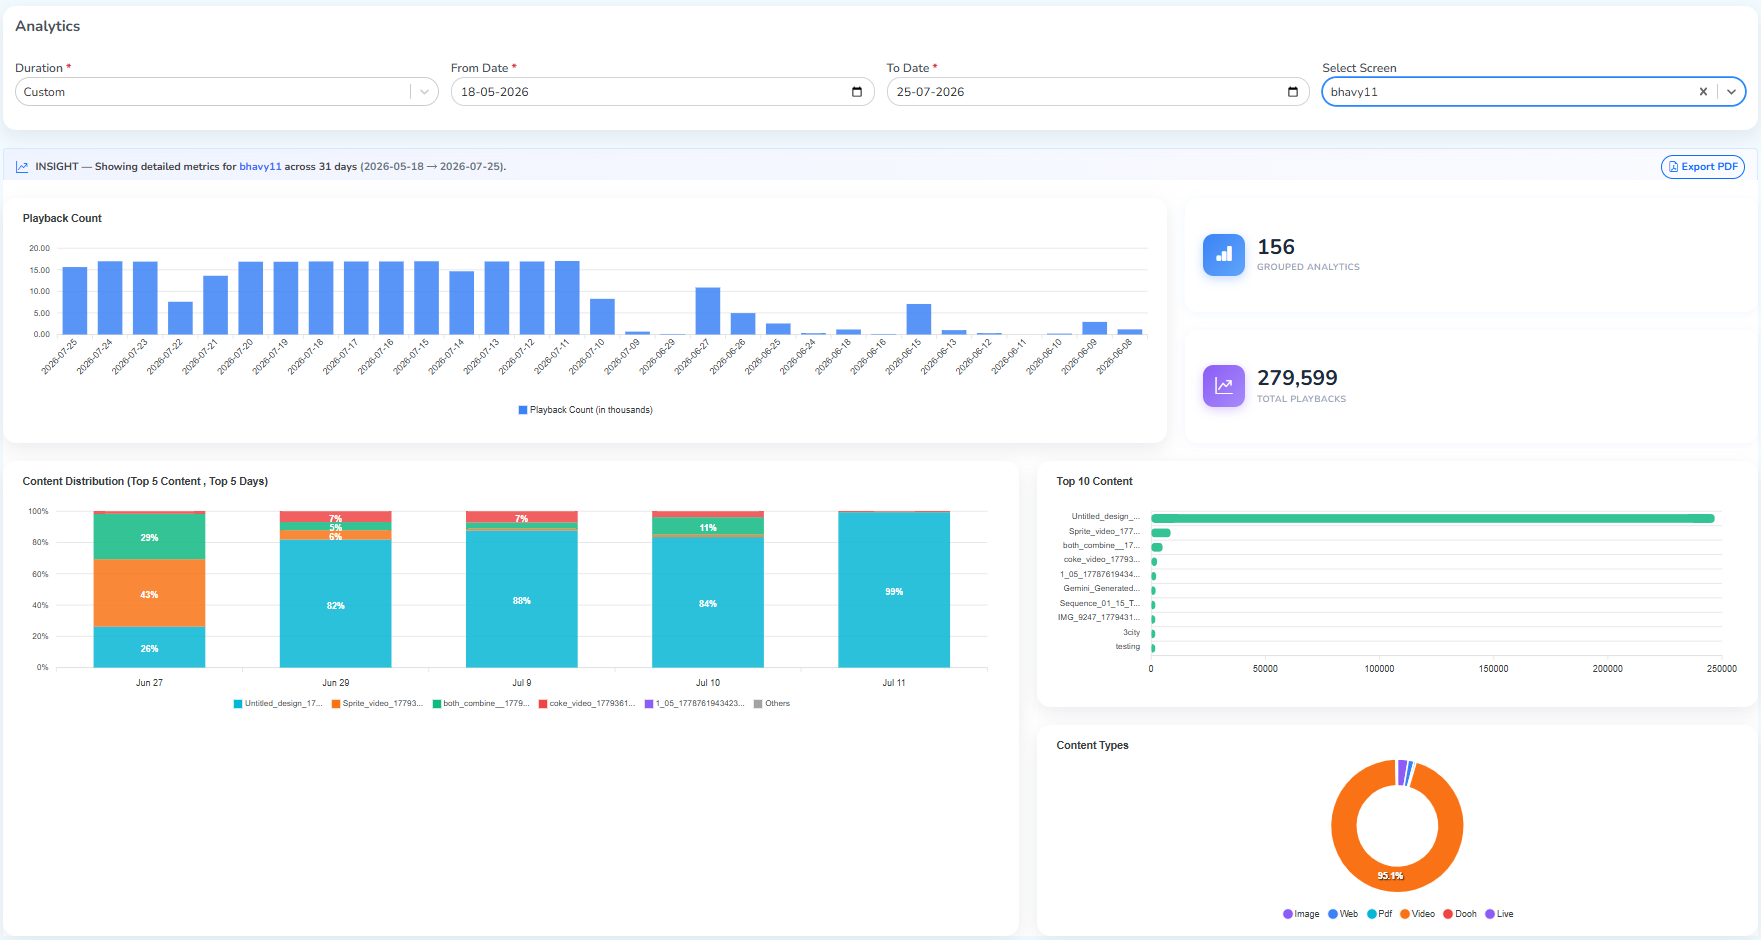
Top Section
The top row sets what the report covers:
Duration– how far back to look.Last 7 Daysis the default, withLast 14 DaysandLast 30 Daysbeside it, andCustomfor a range of your own.From DateandTo Date– the exact start and end date, set together whenDurationisCustom.Select Screen– the screen you want the data for, within that duration.
Playback Count
Playback Count is how many times content switched on the screen – every unique piece of content is counted on its own.
Two images from the same playlist count as two unique content items. Changing a file’s time or date properties for its display also creates a second unique count for that same file, even though it’s the same media.
Click a bar to see the total playback count it lists.
Grouped Analytics– the total number of unique content items over the duration.Total Playbacks– the sum of every bar, the total play count.
OthersThe Content Table
 CSV or PDF, direct downloadSee this in previous reports
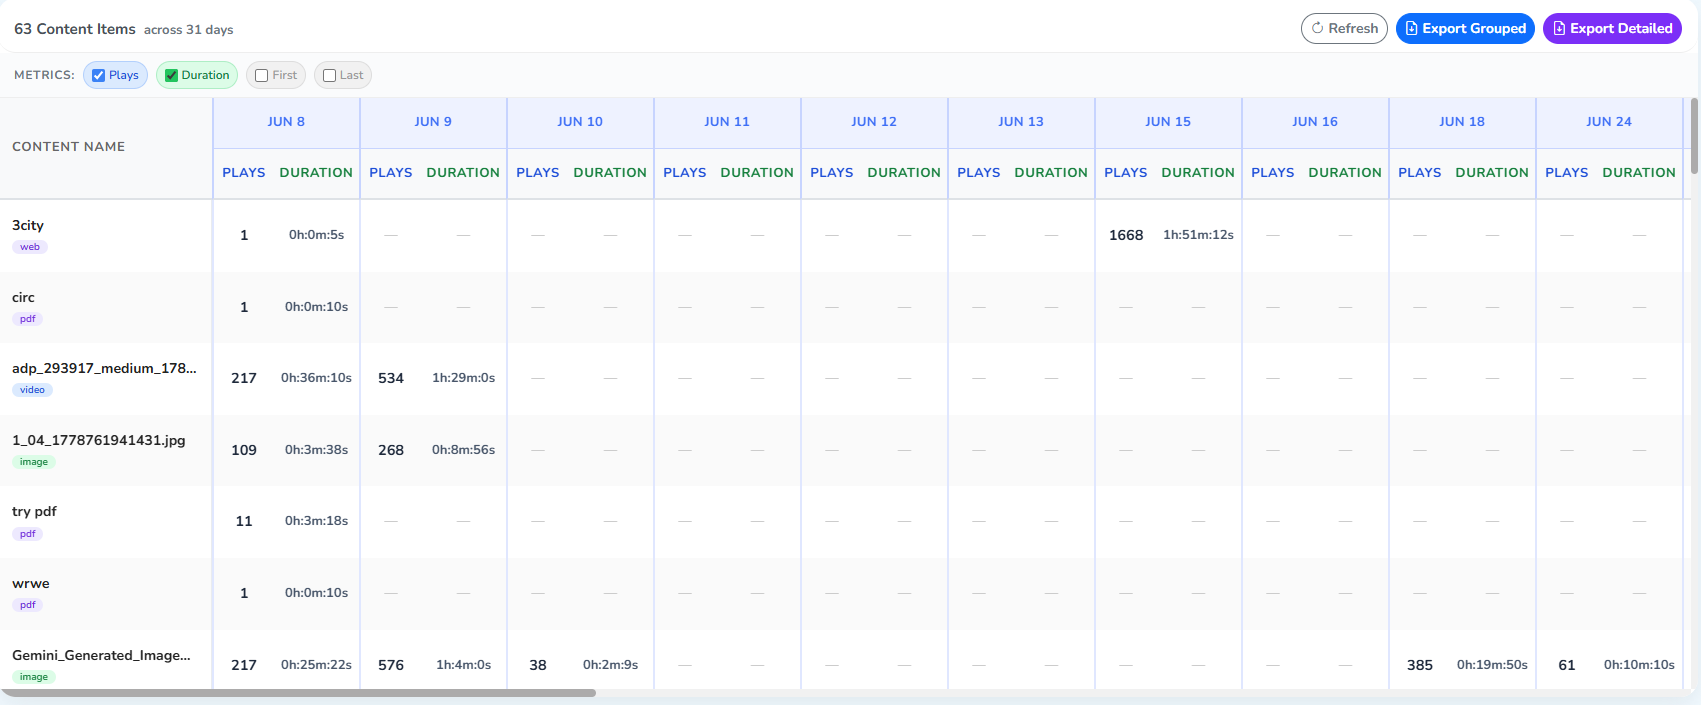
Below the charts sits the detailed table: each row is a content item, and each date column shows that day’s Plays, total Duration, and – when switched on – the First and Last play of the day for that content.
Export Detailed
Click Export Detailed, top-right of the table, to prepare a downloadable detailed CSV file – once it’s ready, collect it from Previous Reports.
Export Grouped
Export Grouped, beside it, downloads a CSV or PDF – whichever you pick – of the content distribution as it currently stands: whatever duration or filter is selected on screen, in either a Classic or Modern layout. It downloads straight to your device instead of going through Previous Reports.
File Analytics
File Analytics answers the inverse question – “where did this file play?” – tracking the below options across every screen it reached. Every media tile in the Library carries its own Analytics icon; see Analytics in the Library overview for where it opens from.
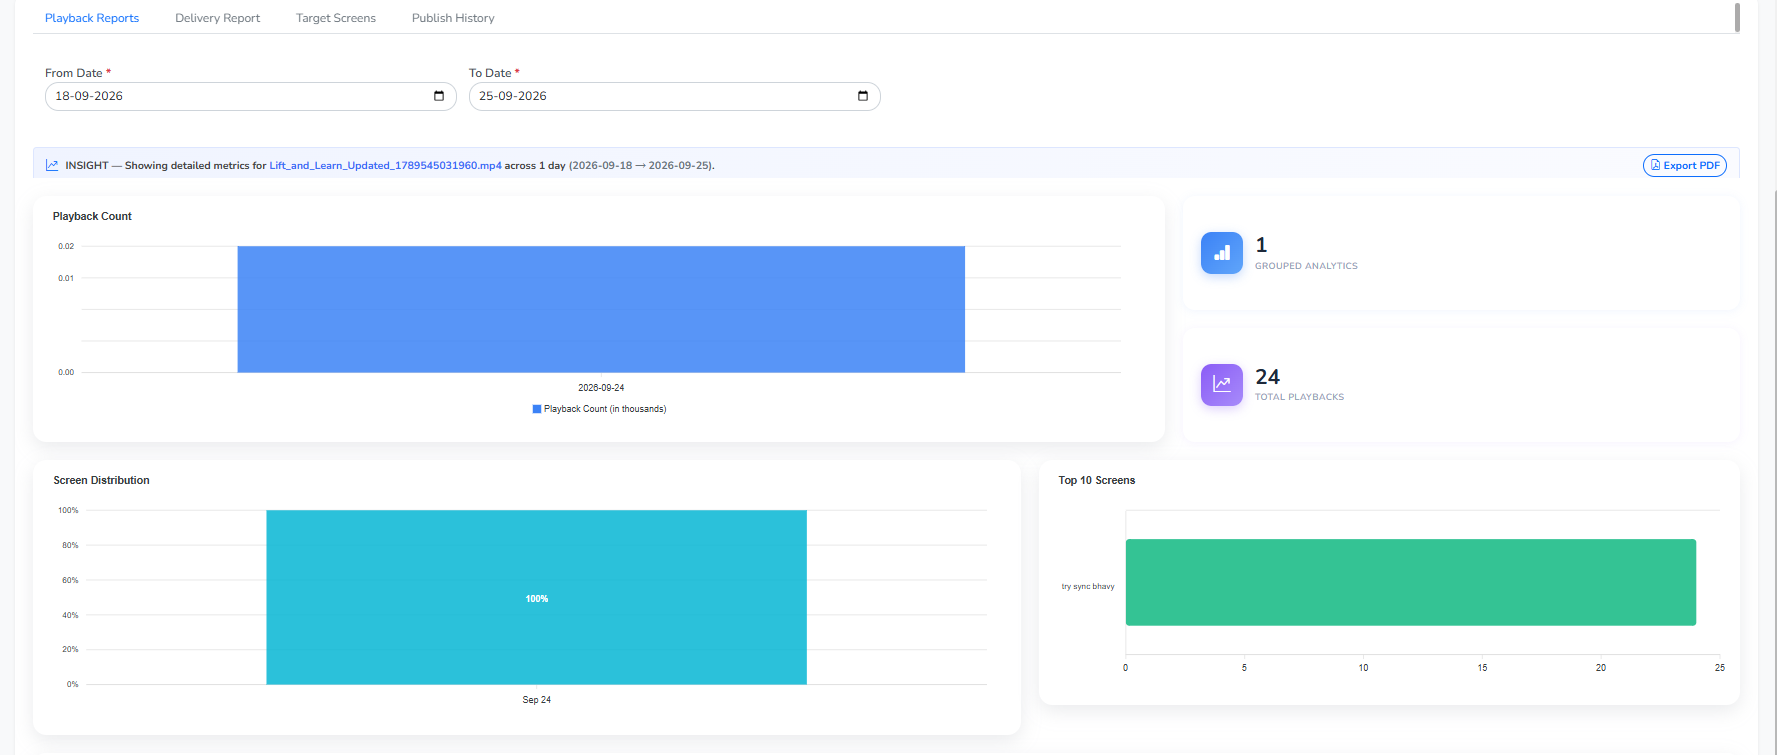 Top SectionPlayback CountScreen DistributionTop 10 Screens
The layout mirrors Screen Analytics, scoped to one file across every screen it reached:
Top Section–From DateandTo Dateset the range; there’s noDurationorSelect Screenhere, since the file is already fixed.Playback Count– the same as Screen Analytics.Grouped Analyticsis the number of unique content items - always one, here, as we are looking analytics for a single file.Total Playbacksis the sum of every bar.Screen Distribution– the same chart asContent Distributionin Screen Analytics, broken down by screen instead of by content.Top 10 Screens– the ten screens that played this file the most, ranked by play count.
 Direct downloadTo Previous Reports
The table above appears in the end of file analytics page and lists one row per screen, with the same Export Grouped and Export Detailed buttons: Export Grouped downloads straight to your device in the format you pick, and Export Detailed lands in Previous Reports with Type File.