Bulk Operations
Tick the boxes beside the screens in the Screens section, and a Next button appears. It lets you perform the options covered so far on many screens together.
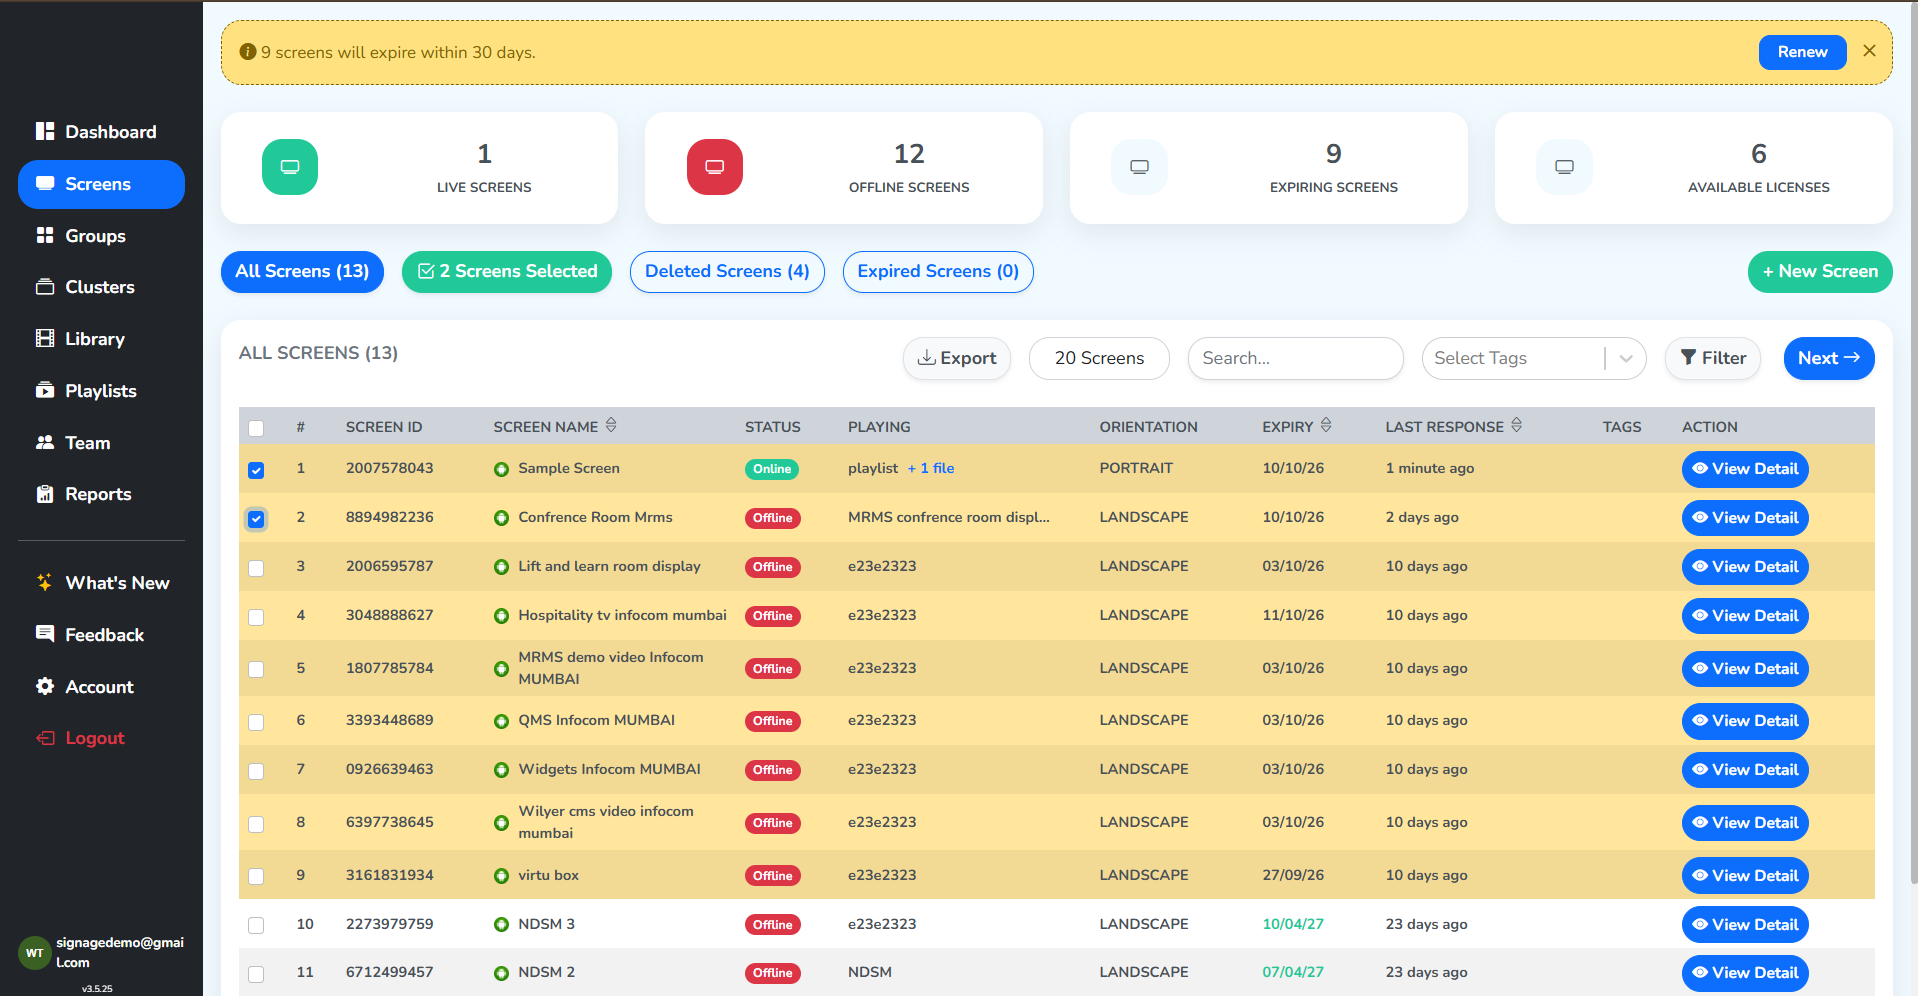 Tick the boxesNext button appears
Click Next. The options on the left are the bulk operations, and the screens they act on are listed on the right. Selected screens at the top of the right menu, lists these screens again. The red delete button on a row takes that screen out of the selection.
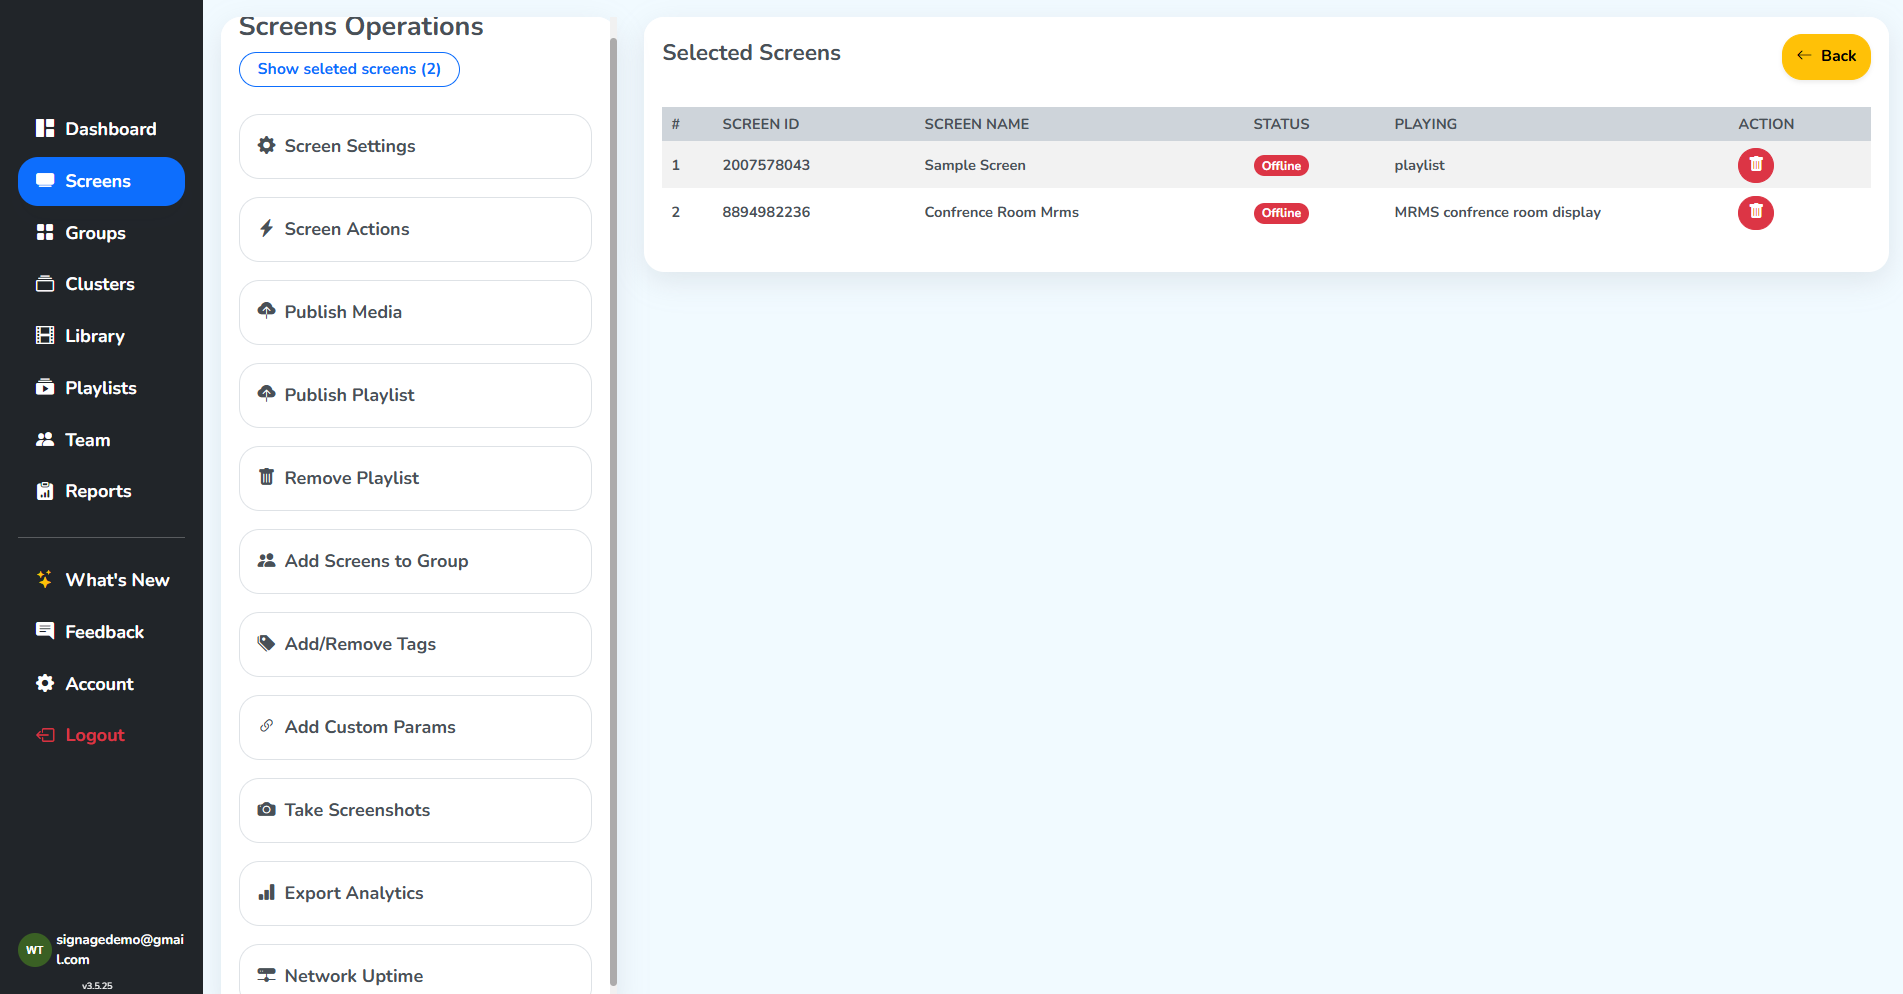 Bulk operationsScreens they act on
Screen Settings
Changes the same settings on every selected screen at once. Its options are like the Configurations tab of a single screen.
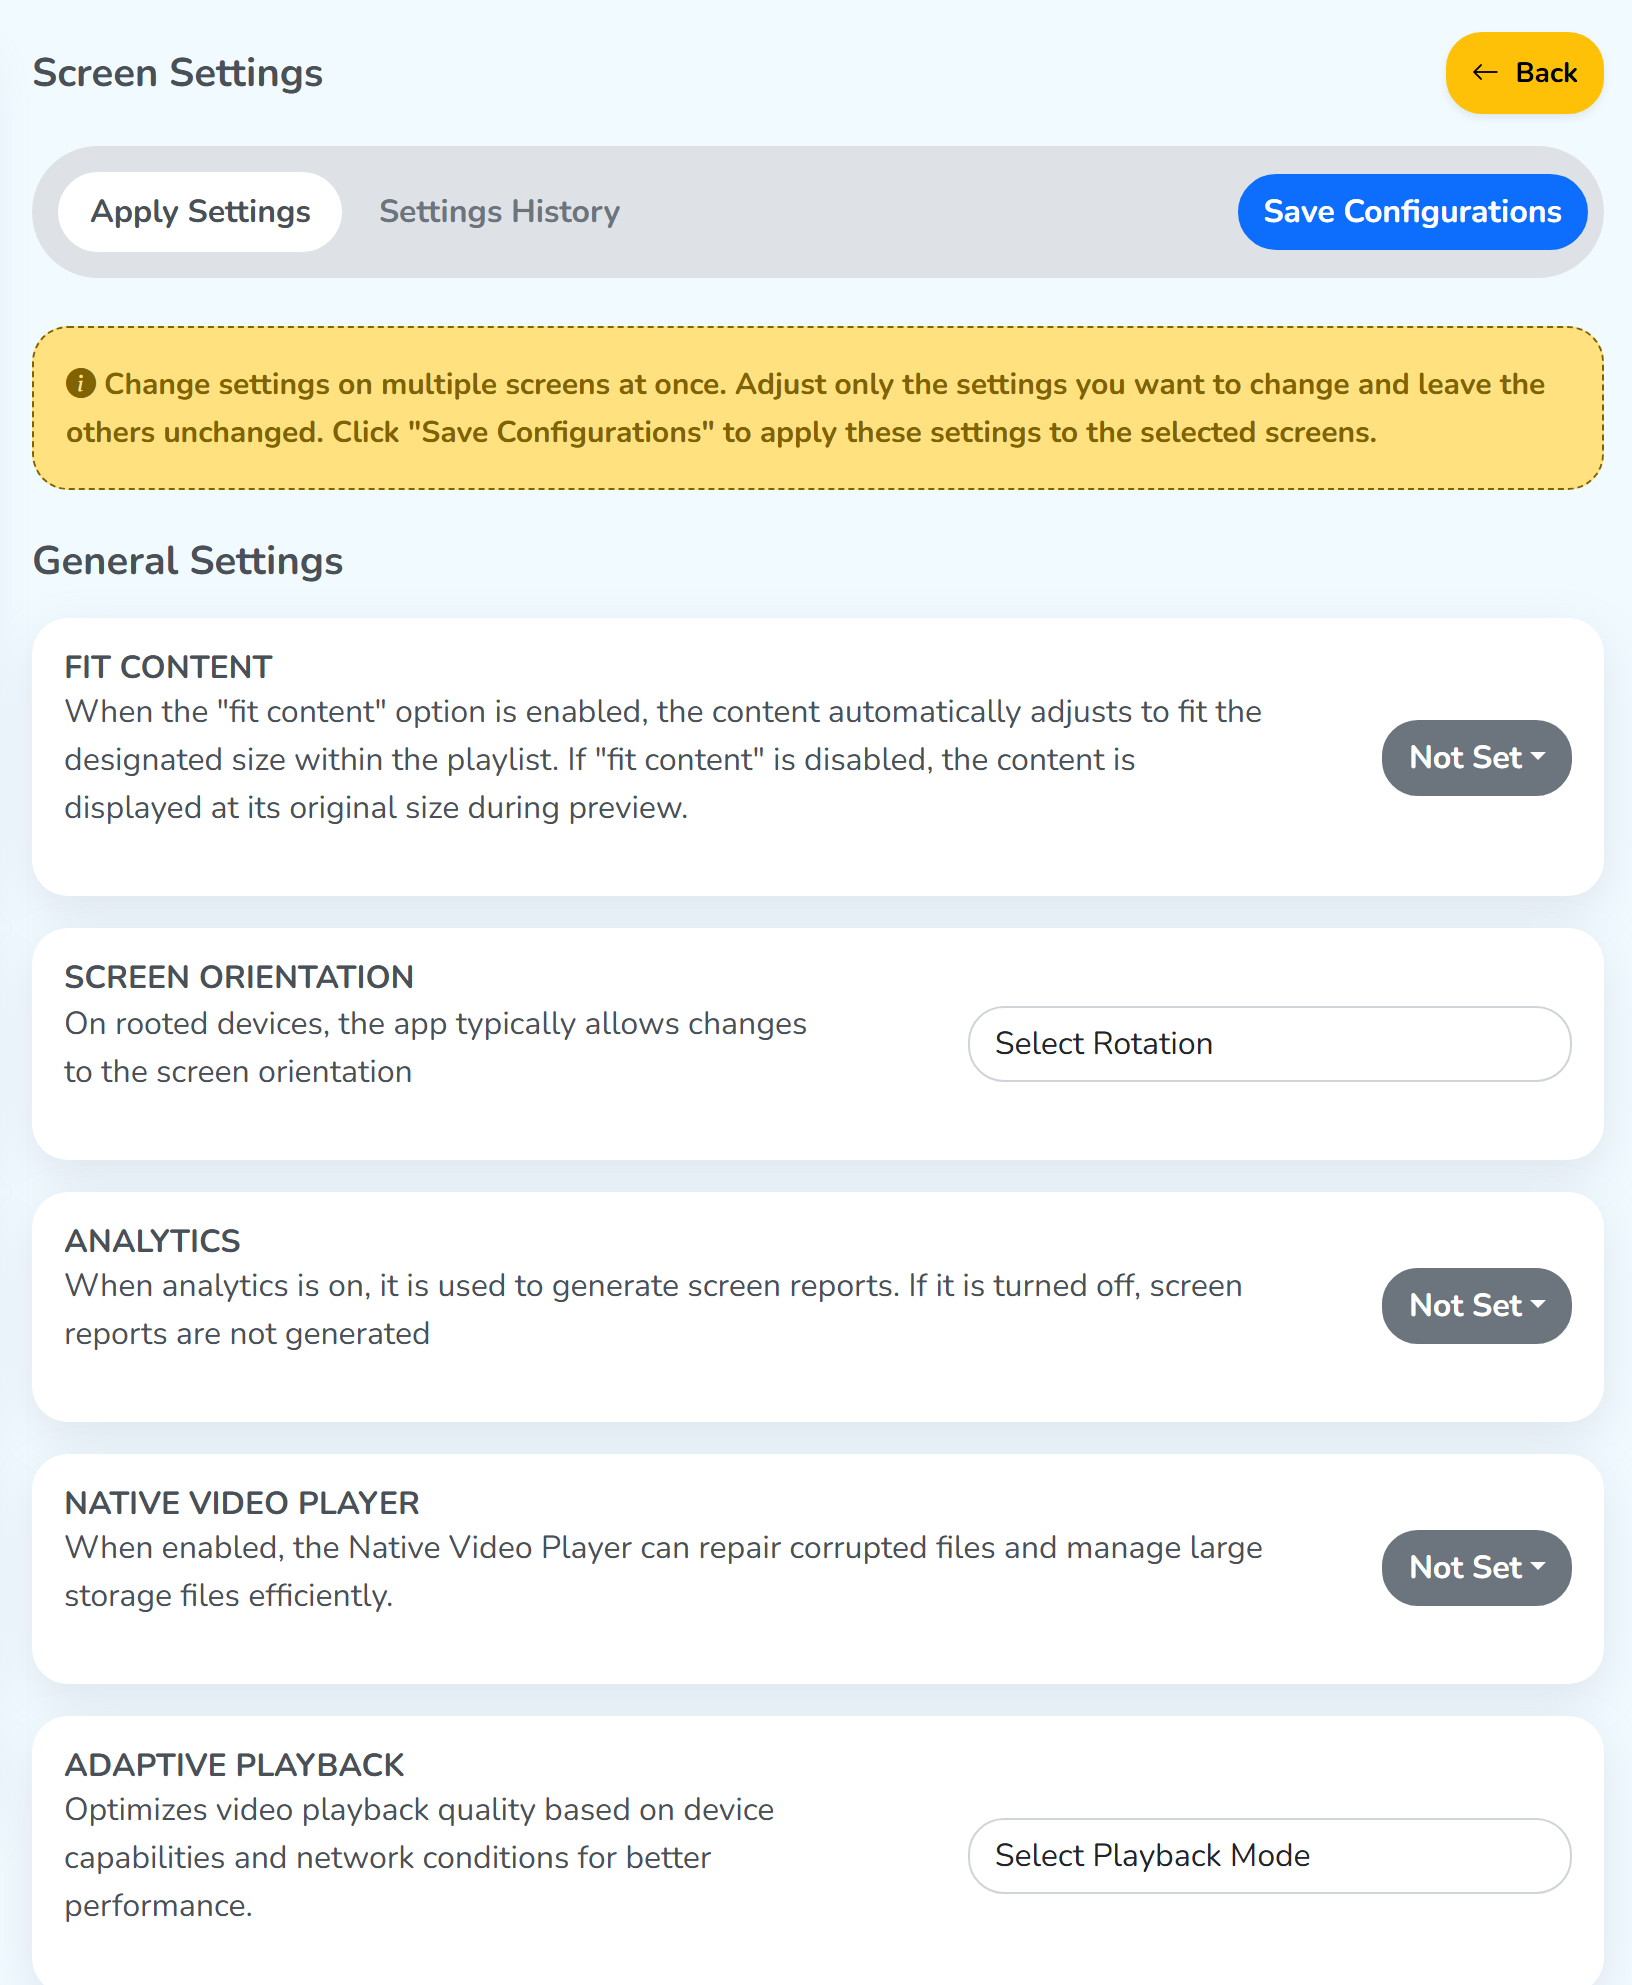 The form, and a record of each changeSends the changed controls to the screensKeeps each screen's own value
Top tabs
- Apply Settings: the form below. Every control starts at
Not Set. - Settings History: a record of each settings change, with the screens, the setting and the date.
Not Set
A control left at Not Set keeps each screen’s own value. Only the controls you change are sent to the screens.
Each control opens at
Not Set. Turn it on or off, clickSave Configurations, and the setting changes on the selected screens. You can check it in each screen’s Configurations tab. The control shows your choice for the rest of that visit, so you can quickly review the changes you came to make before you leave. Come back later, and it showsNot Setagain. To see what you changed on different visits, open theSettings Historytab.
Available controls
- General Settings: Fit Content, Screen Orientation, Analytics, Native Video Player, Adaptive Playback.
- Location Settings: a map, a location search, and fields for the address.
- Player Settings: Built-in App Rotation, Device Volume, Auto Start at Boot, Dot Indicators, Keep On Top, Device Protection.
- Kiosk Settings: Tablet Mode, Device Owner.
- Schedule Brightness and Screen Turn Off Schedule.
- Contact Details: On Site Staff Information and On-Site Screen Information.
Click Save Configurations at the top right to apply them.
Screen Actions
Four actions that run on every selected screen at once. Each one is a card with a short description and its own button.
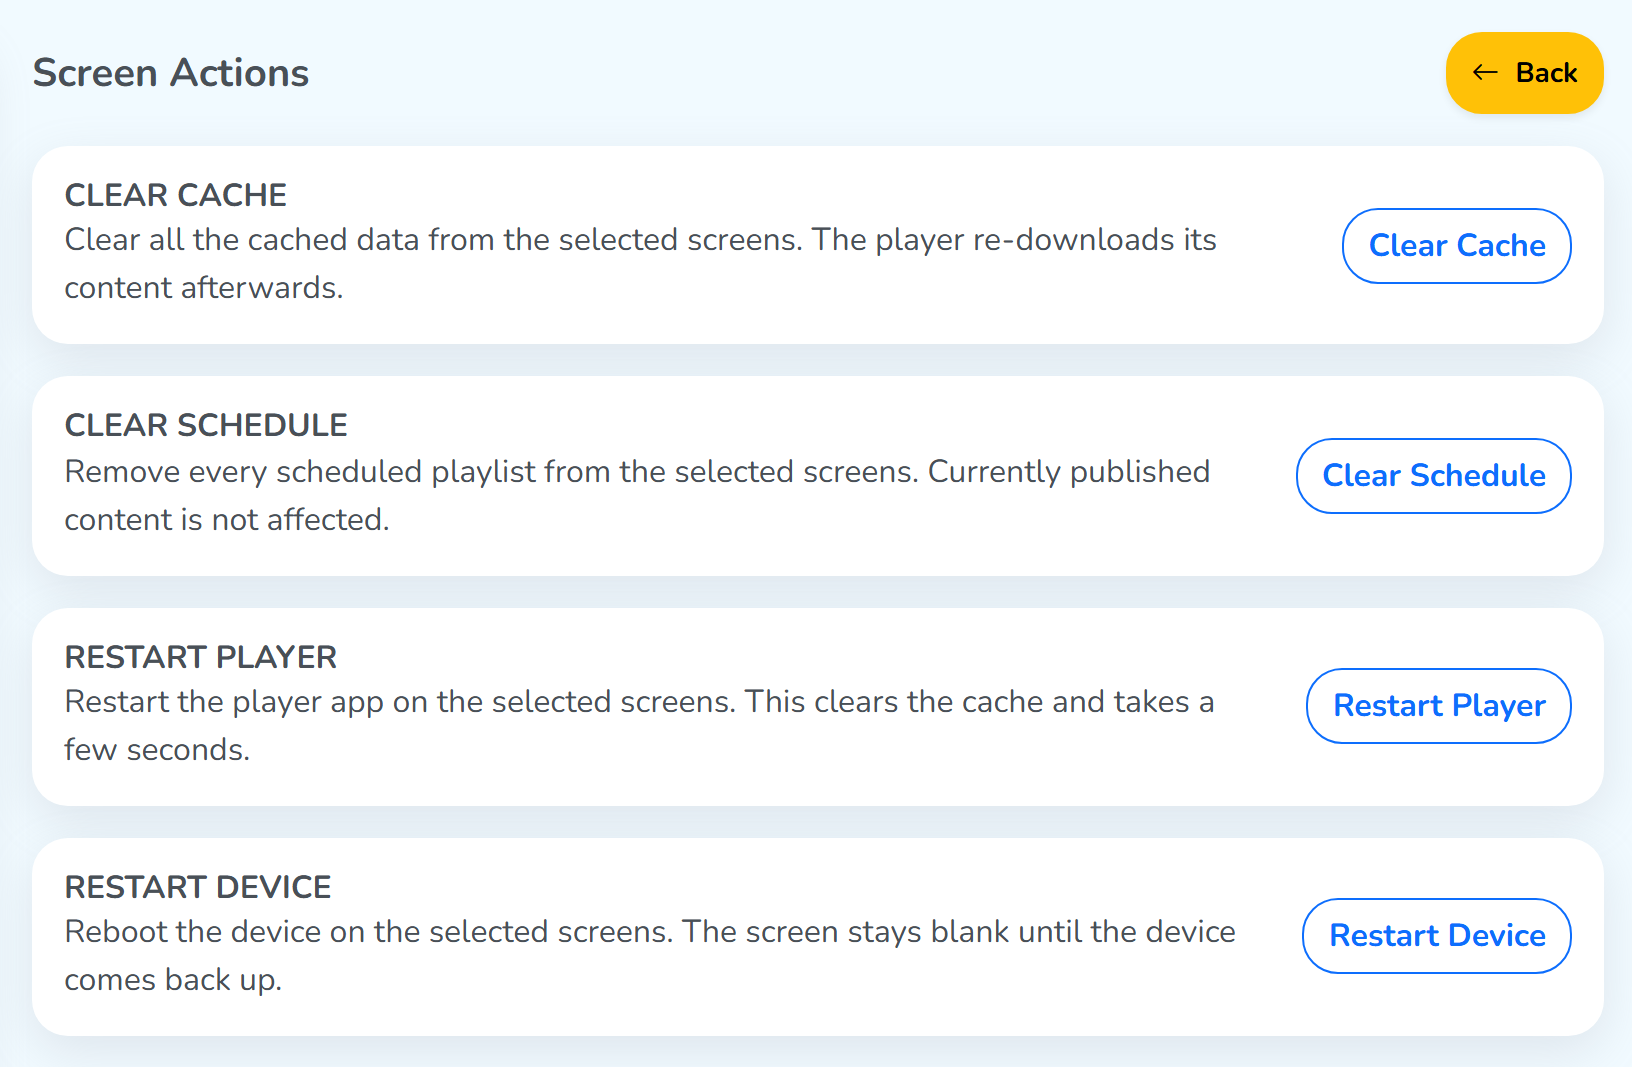
- Clear Cache: clears all the cached data from the selected screens.
- Clear Schedule: removes every scheduled playlist from the selected screens.
- Restart Player: restarts the signage app on the selected screens.
- Restart Device: restarts the selected screens. It works with rooted devices only.
Publish Media
Sends media files and widgets to every selected screen.
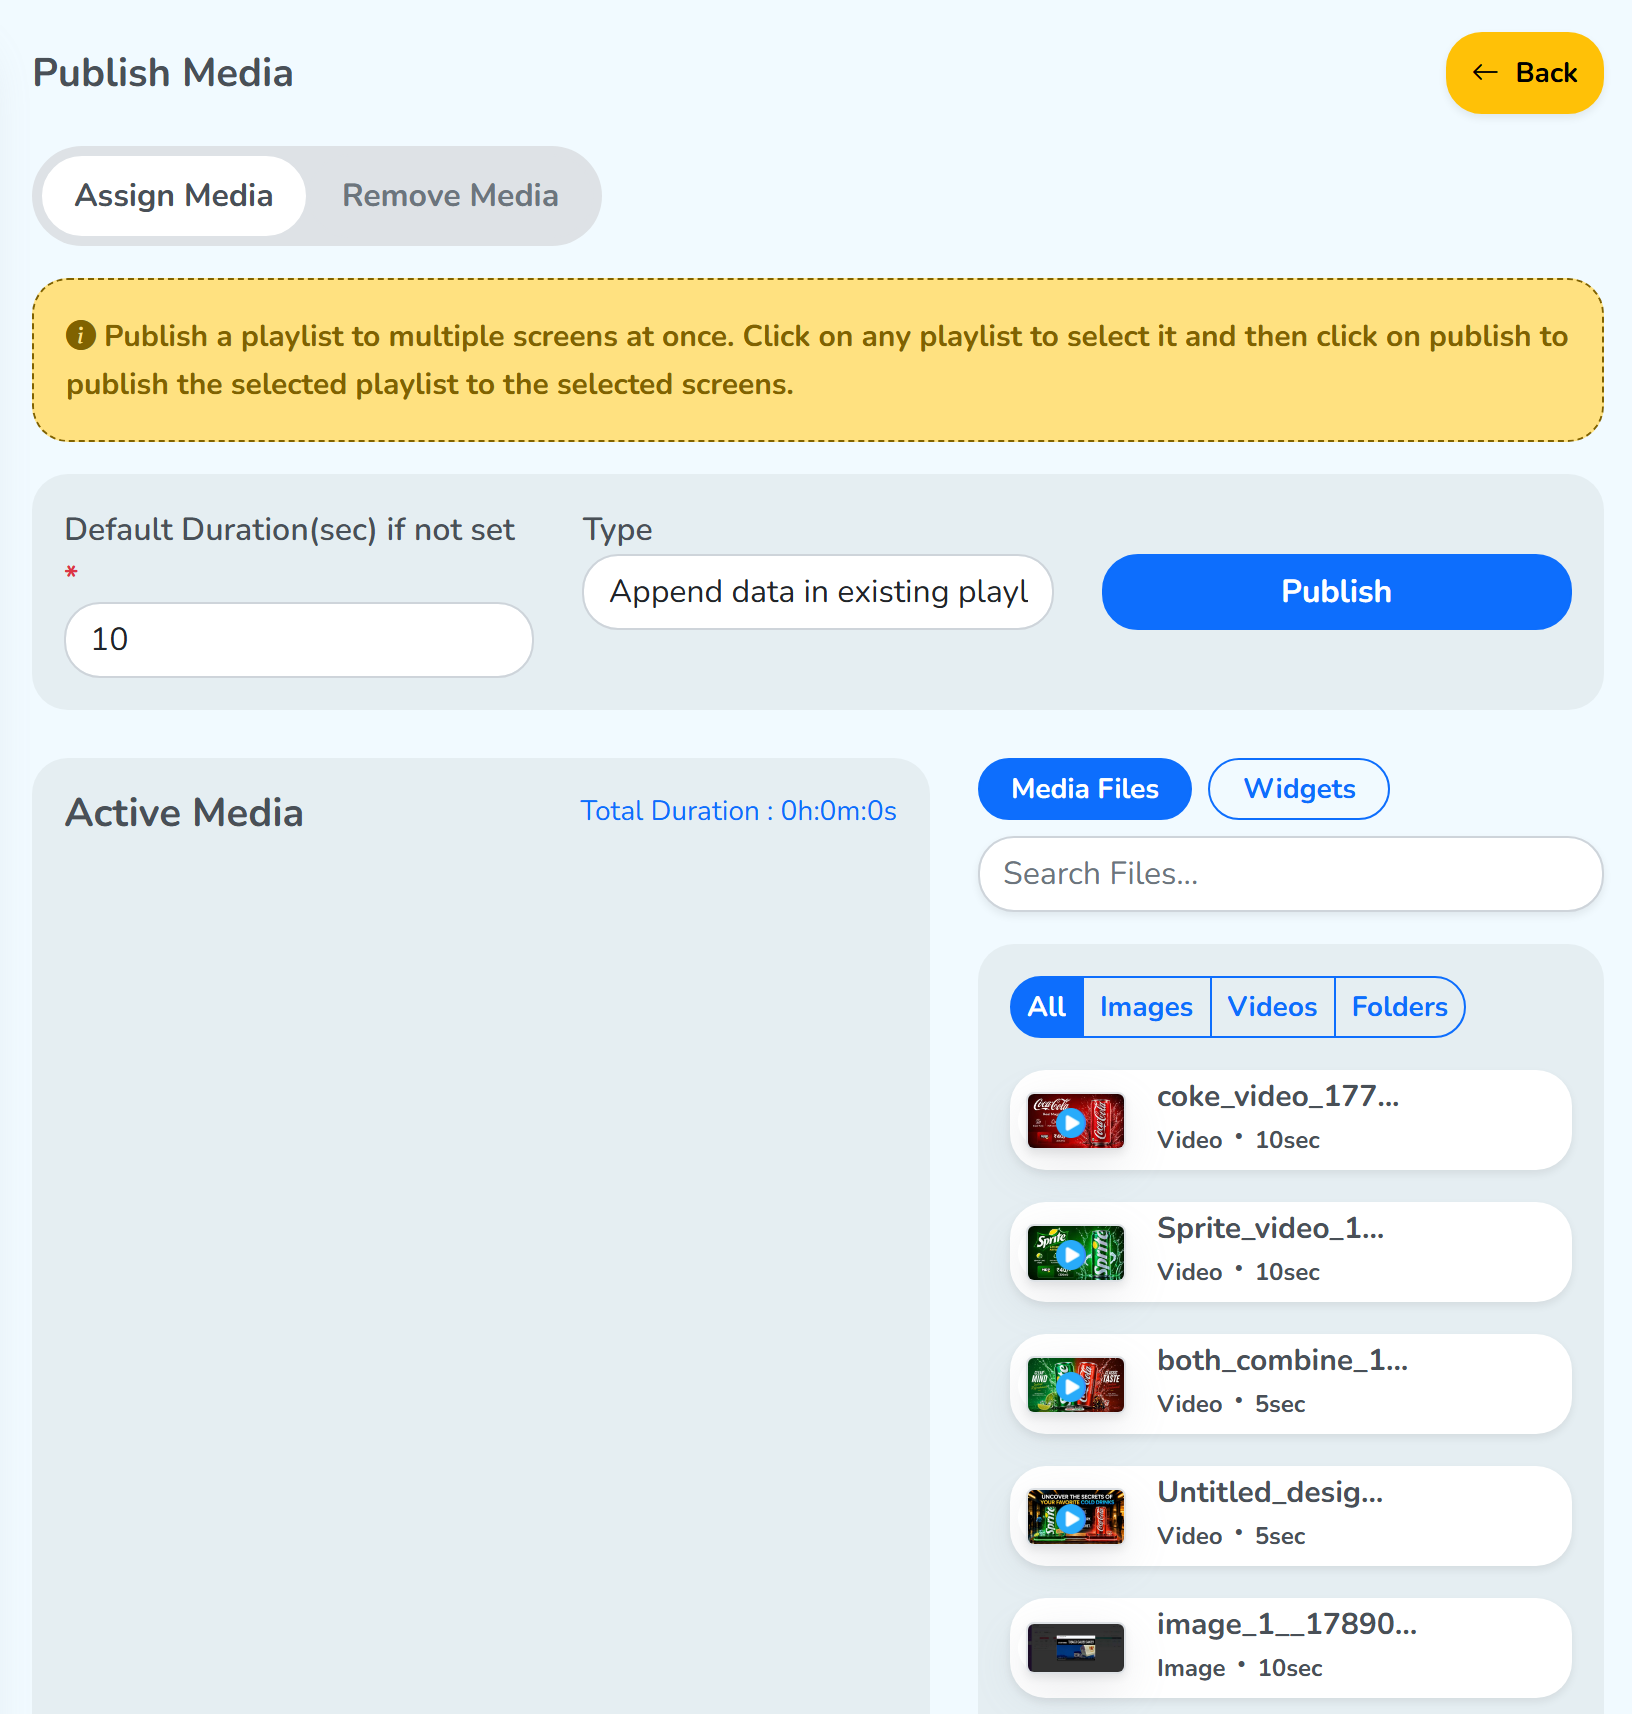 Assign or remove mediaAppend, or publish as a new playlistDrag files hereYour Library
Top tabs
- Assign Media: pick media from your Library and publish it.
- Remove Media: removes published media from the selected screens.
Form fields
- Default Duration (sec) if not set: how long each item plays, when the item has no duration of its own.
- Type:
Append data in existing playlistadds the media to the playlist each screen is playing.Publish as new playlistpublishes the media as a new playlist and removes what screen was playing until now.
Library
The right panel shows your Library.
- Tabs:
Media FilesandWidgets. - Filters:
All,Images,Videos,Folders. - Search: finds a file by its name.
Active Media
Drag files from the right panel into Active Media in the middle. Each file shows a thumbnail, a duration control (– and +), a schedule button and a red × to remove it. Total Duration at the top right in this panel adds them up. Click Publish at the top right to send them to every selected screen.
Publish Playlist
Sends one playlist to every selected screen.
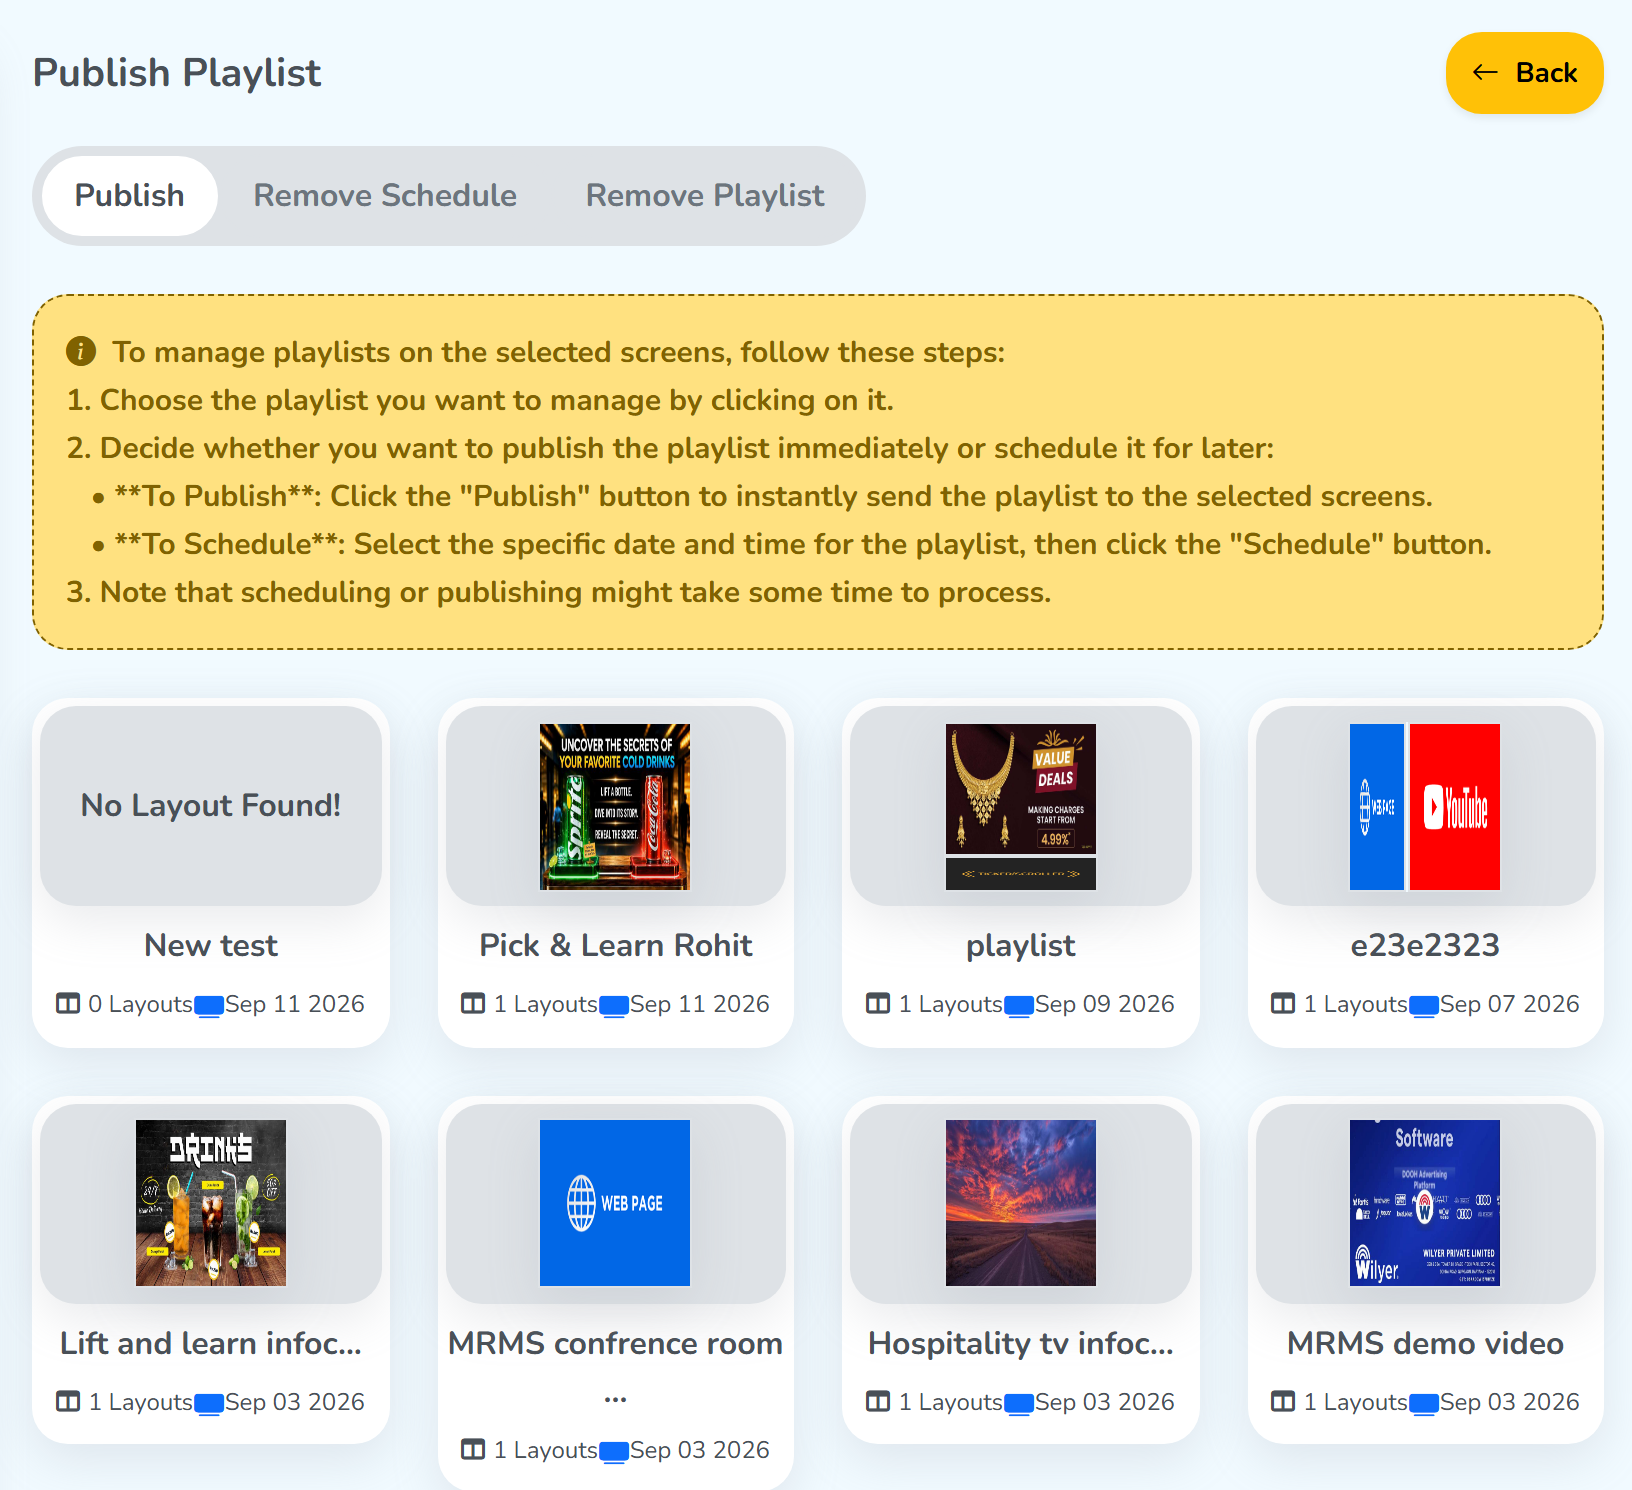 Click a tile to choose it
Publish
The Publish tab sends a playlist to every selected screen, either right away or at a date and time you choose.
Follow the steps in the yellow note on the screenshot.
The grid below shows your playlists. Click a tile, and the Publish and Schedule buttons appear at the top right.
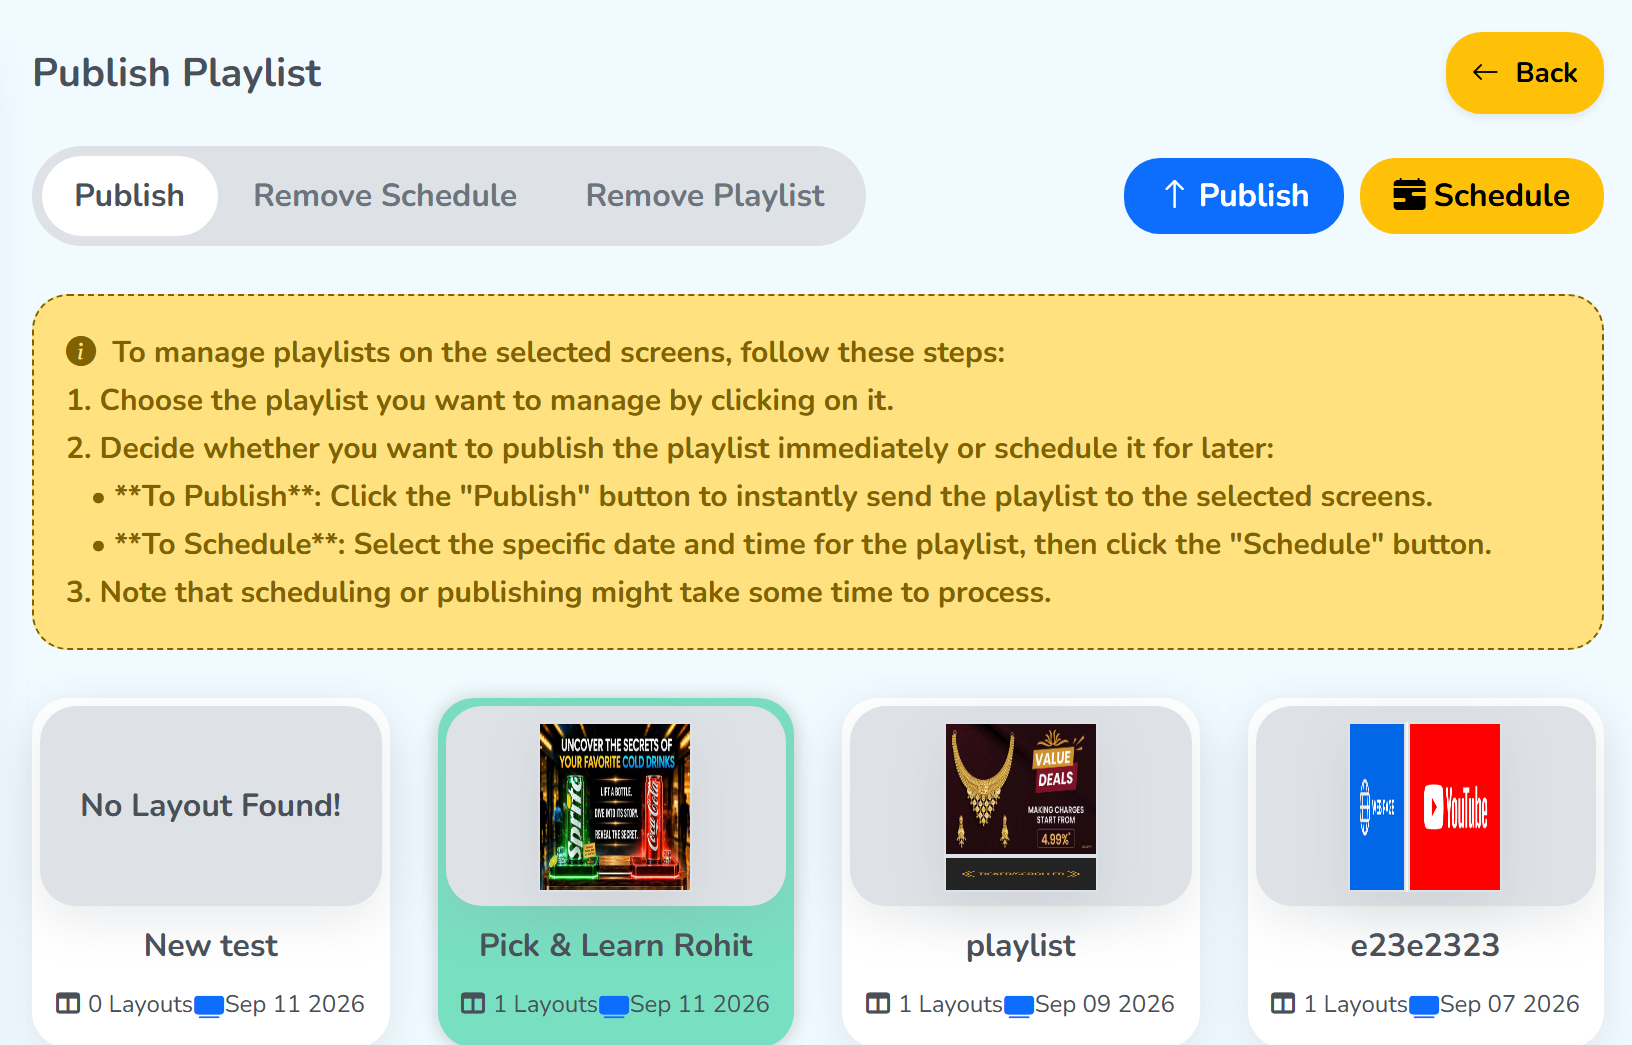 Appear after you click a tileThe tile you clicked
Remove Playlist
Removes the playlist from every selected screen.
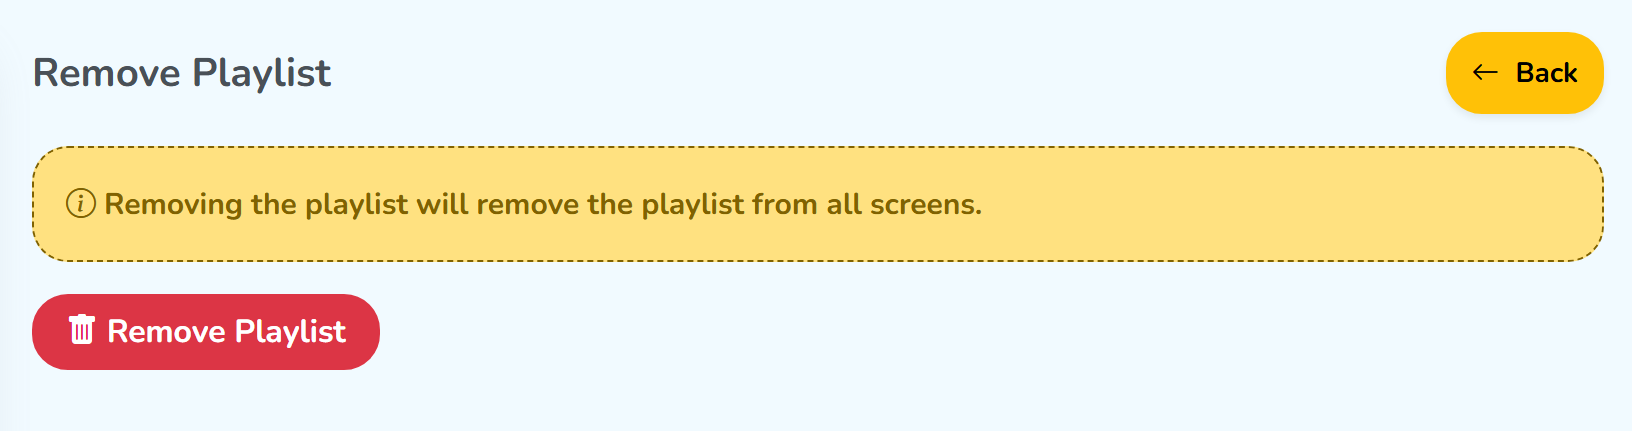 Removes it from every selected screen
Click the red Remove Playlist button.
Add Screens to Group
Adds every selected screen to a group. Groups have their own pages: Groups overview and Group Settings.
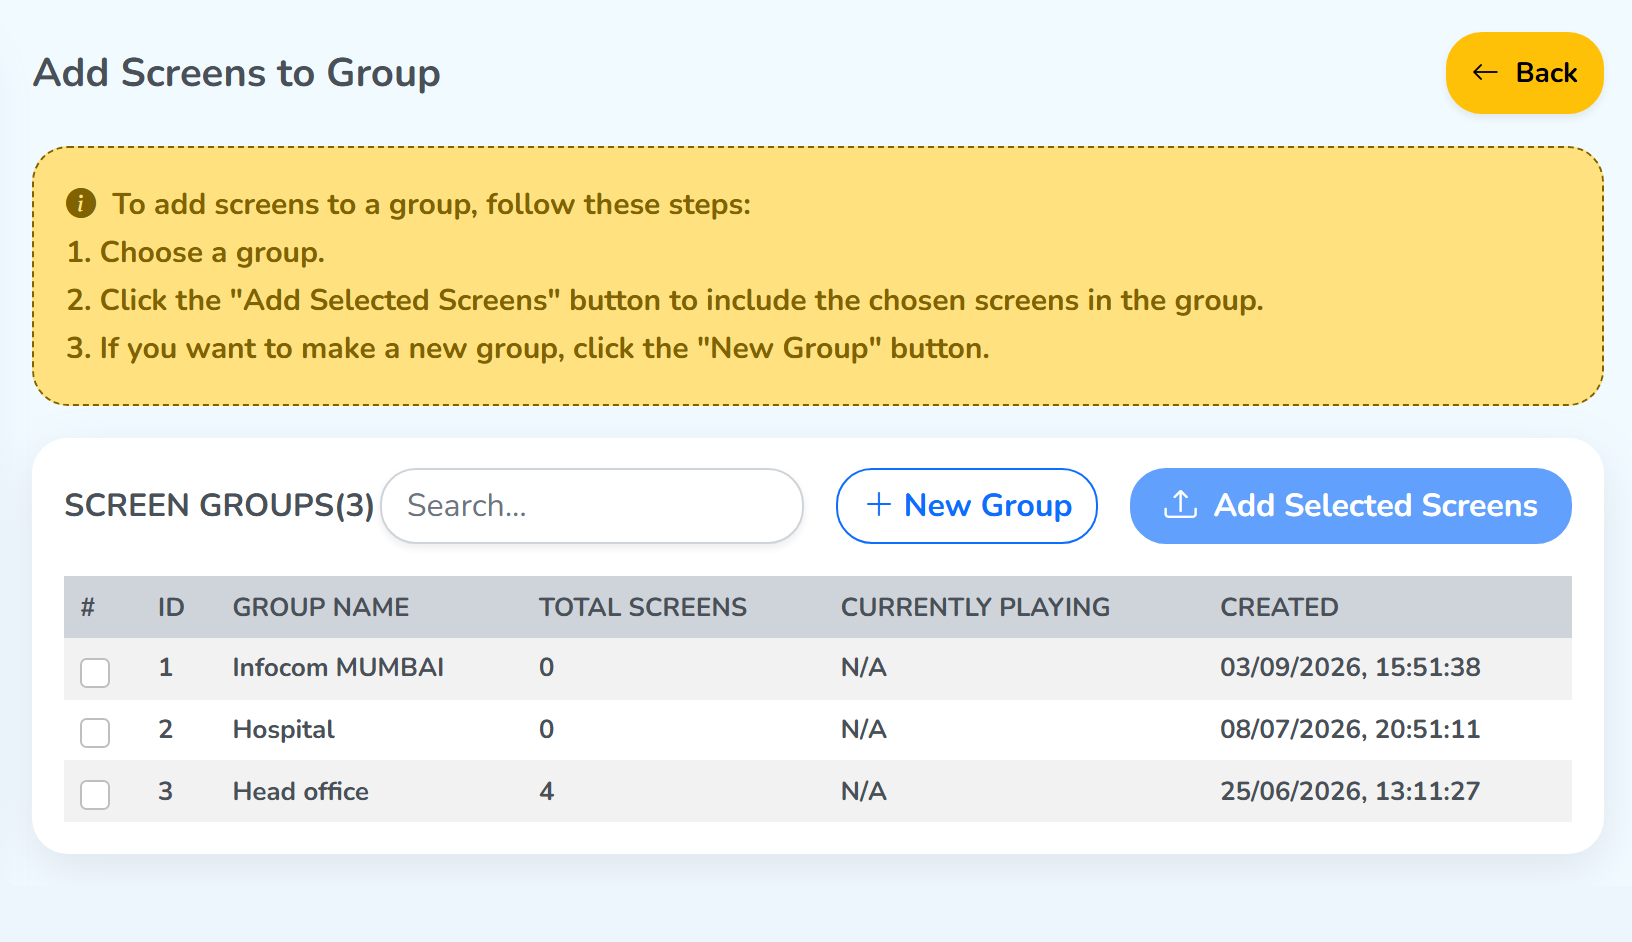 Opens the Create Group dialogTick one or more groups
The table
Each group is a row with a checkbox, the group name, the total screens, the playlist it is playing and the date it was created. Tick one or more groups, then click Add Selected Screens at the top right.
+ New Group, beside the search field, opens the Create Group dialog. The steps are in Create a New Group.
Add/Remove Tags
Adds tags to, or removes them from, every selected screen.
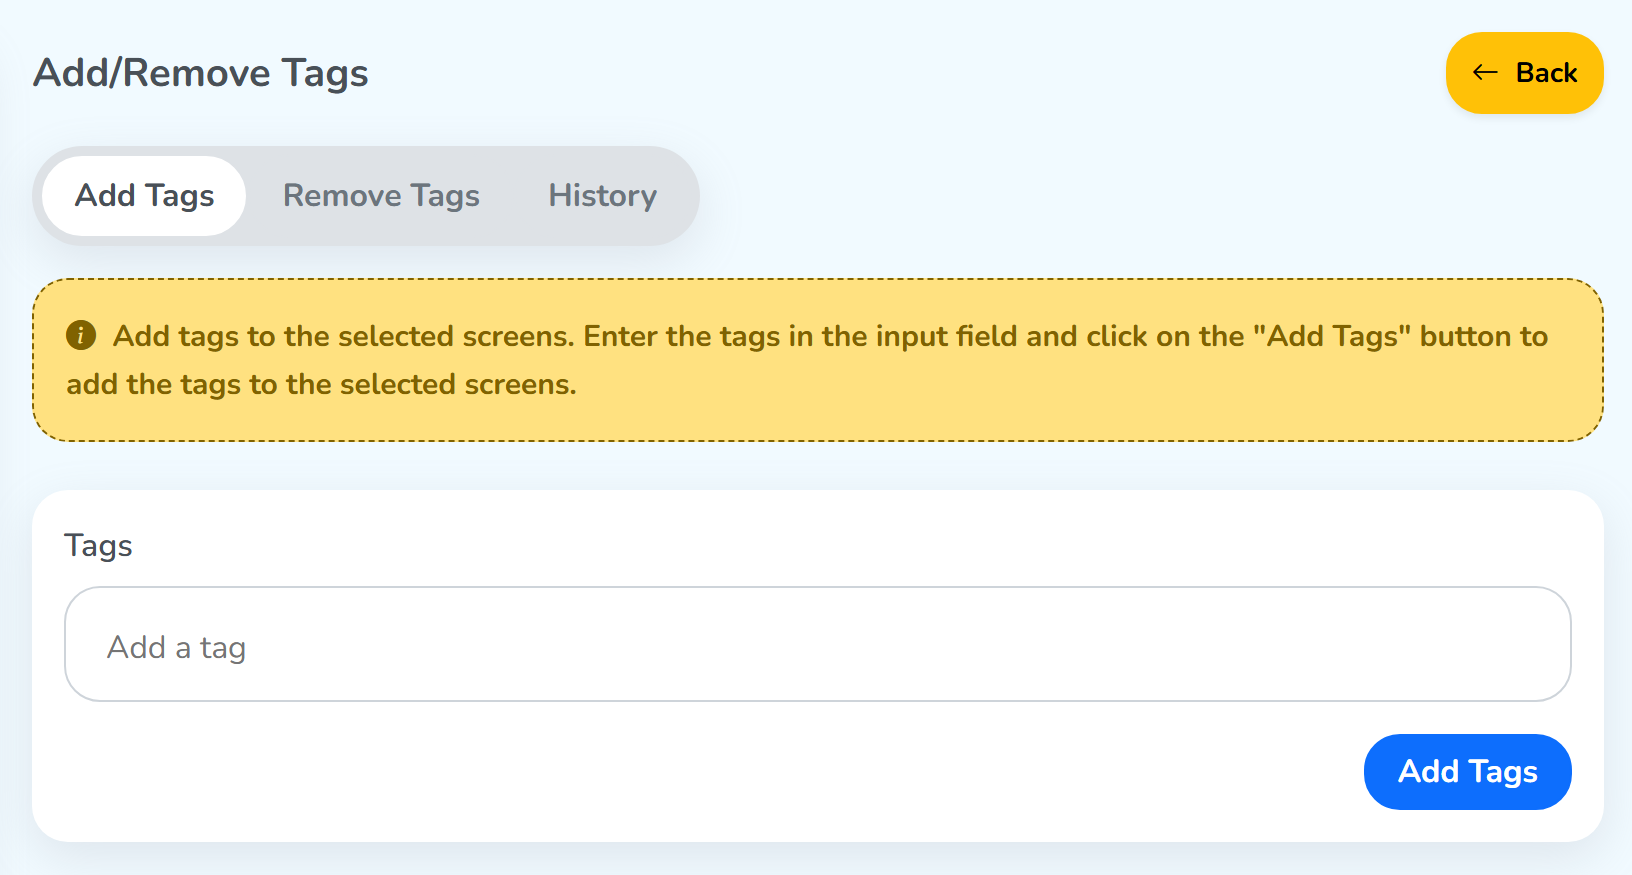 Add, remove, or see past changesType the tag names here
Top tabs
- Add Tags: adds tags to the selected screens.
- Remove Tags: removes tags from the selected screens.
- History: a record of past tag changes, with the date and time.
Form
- Tags: type the tag names here.
Add Tags / Remove Tags: the button on the right applies the change.
Type a tag name in the
Tagsfield, then press Enter. Only then does the system recognize it as a tag, and you can add or remove it.
Add Custom Params
Sets custom params on every selected screen at once, with a value for each screen under the same key.
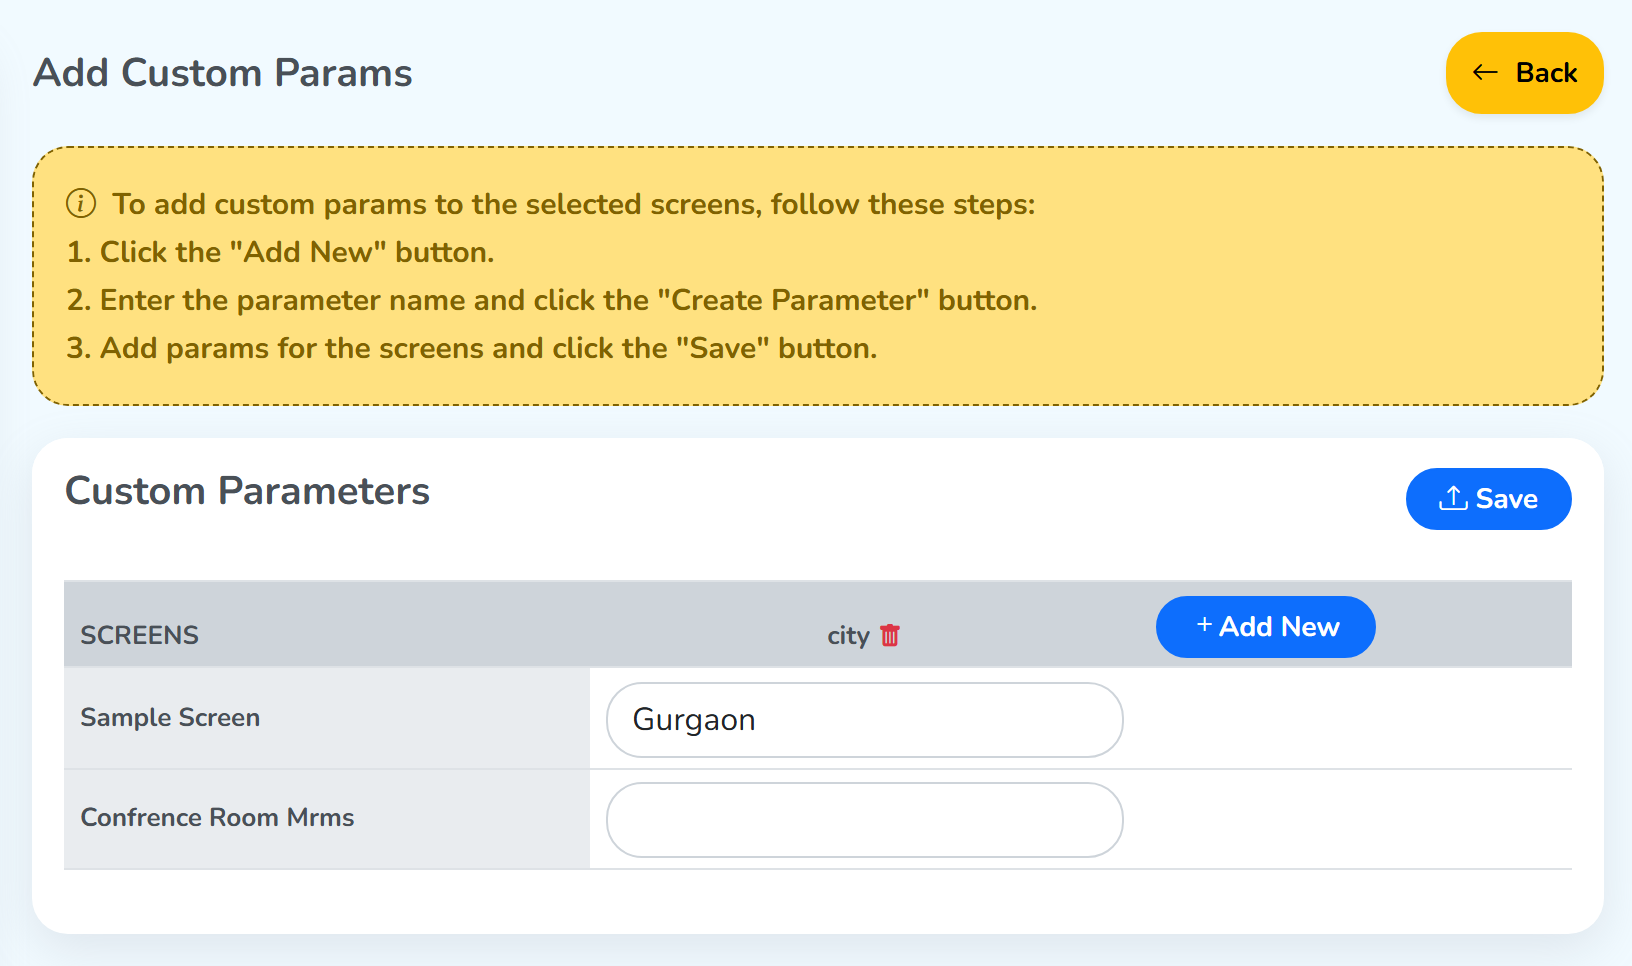 Sends the values to the screensAdds a column for a new parameterA value for each screen
Follow the steps in the yellow note on the screenshot.
Layout
A table titled Custom Parameters, with one row for each selected screen and one column for each parameter.
+ Add New
Click + Add New at the top right of the table. The New Parameter dialog opens. Type a name in Parameter Name and click Create Parameter.
The dialog closes, and a new column with that name joins the table, with a delete button beside its name. Every cell in the column can be edited.
Fill in the values. Enter a value for each screen in the new column. The same key can carry a different value on each screen. Click Save at the top right to send the params to all the selected screens.
A single screen’s values also show on its Custom Params tab.
Take Screenshots
Takes a screenshot from every selected screen. It works with rooted devices only.
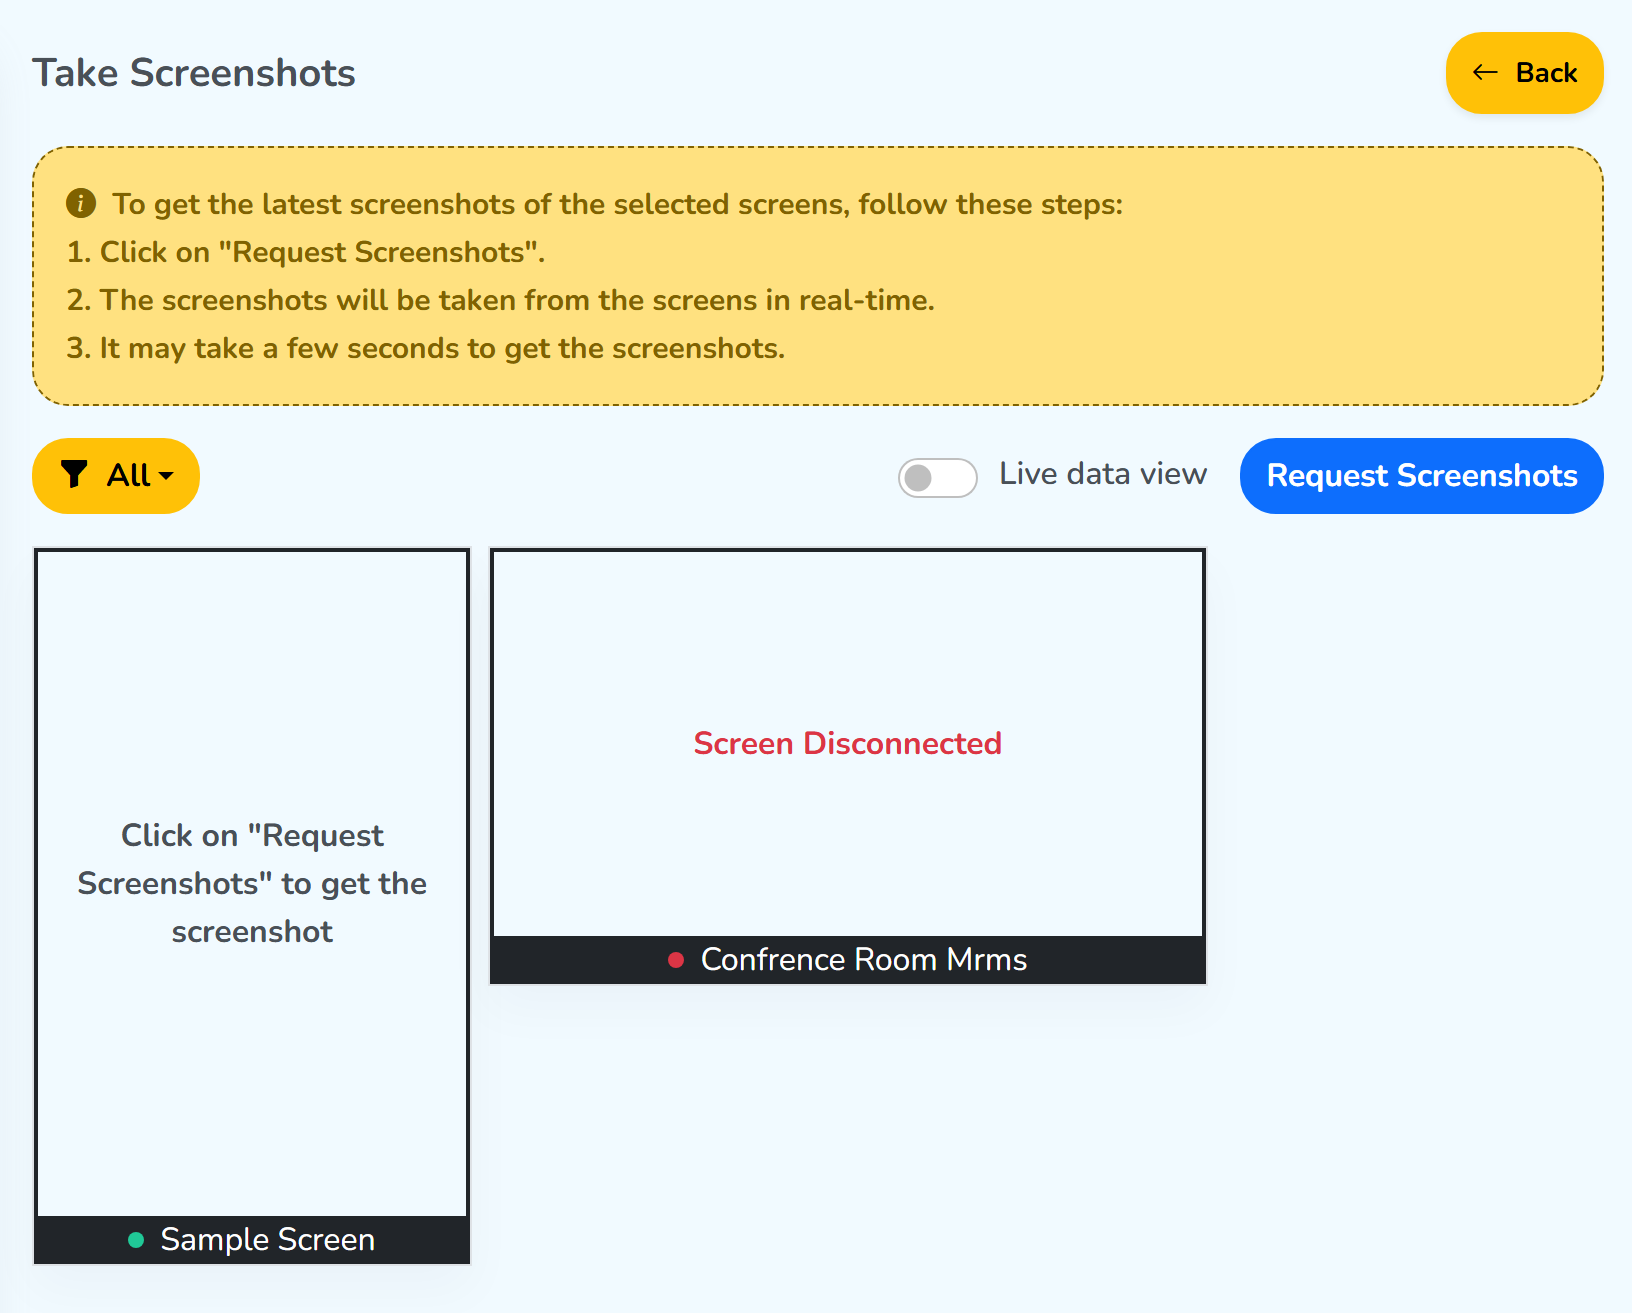 Shows screens by statusTakes the screenshotsOne tile for each selected screen
Follow the steps in the yellow note on the screenshot.
Toolbar
All ▾: shows the screens by status, Online or Offline.Live data view(toggle): shows each screen’s content from the CMS.Request Screenshots(blue button): takes the screenshots.
Tiles
One tile for each selected screen, with the screen name. Before a request, a tile reads “Click on ‘Request Screenshots’ to get the screenshot”, or “Screen Disconnected” when the screen is offline. After the request, each online screen’s tile shows its screenshot.
Export Analytics
Exports analytics for every selected screen.
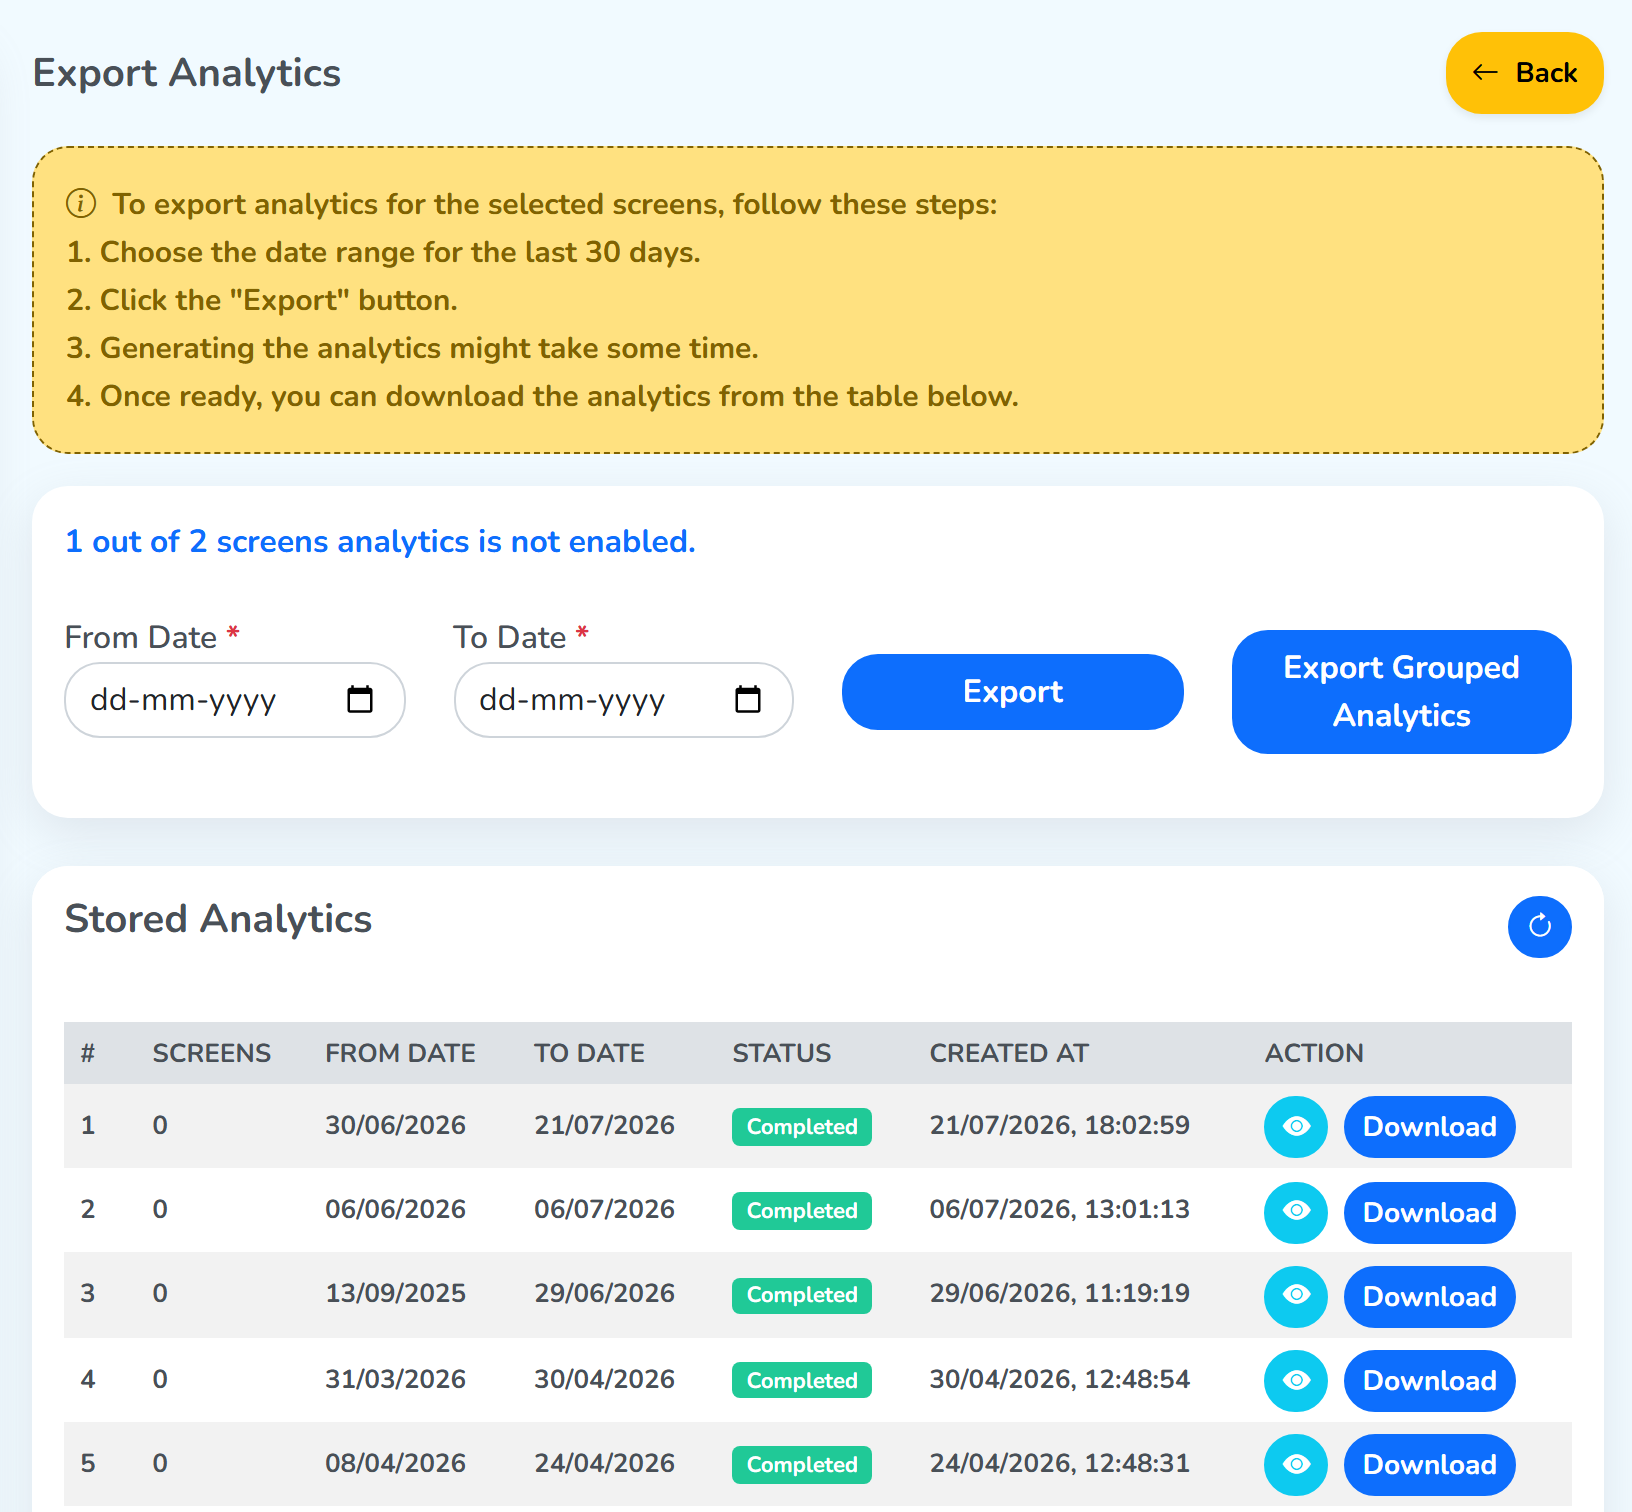 The date rangeAdds a row to Stored AnalyticsDownloads an Excel sheetDownload a report again later
Follow the steps in the yellow note on the screenshot.
Form
The small blue line above the dates shows how many of the selected screens have analytics turned off. Analytics is turned on for each screen in its Configurations tab, under General Settings.
- From Date / To Date: the date range, up to 30 days apart.
- Export: starts the export. It appears in the Stored Analytics table below.
- Export Grouped Analytics: downloads the analytics to your computer as an Excel sheet.
Stored Analytics
Each export is a row with #, Screens, From Date, To Date, Status, Created At, and an eye button and a Download button under Action. Status reads Completed once the report is ready. A report stays in the table, so you can download it again later.
Network Uptime
Shows when each selected screen was online and offline over the last 15 days.
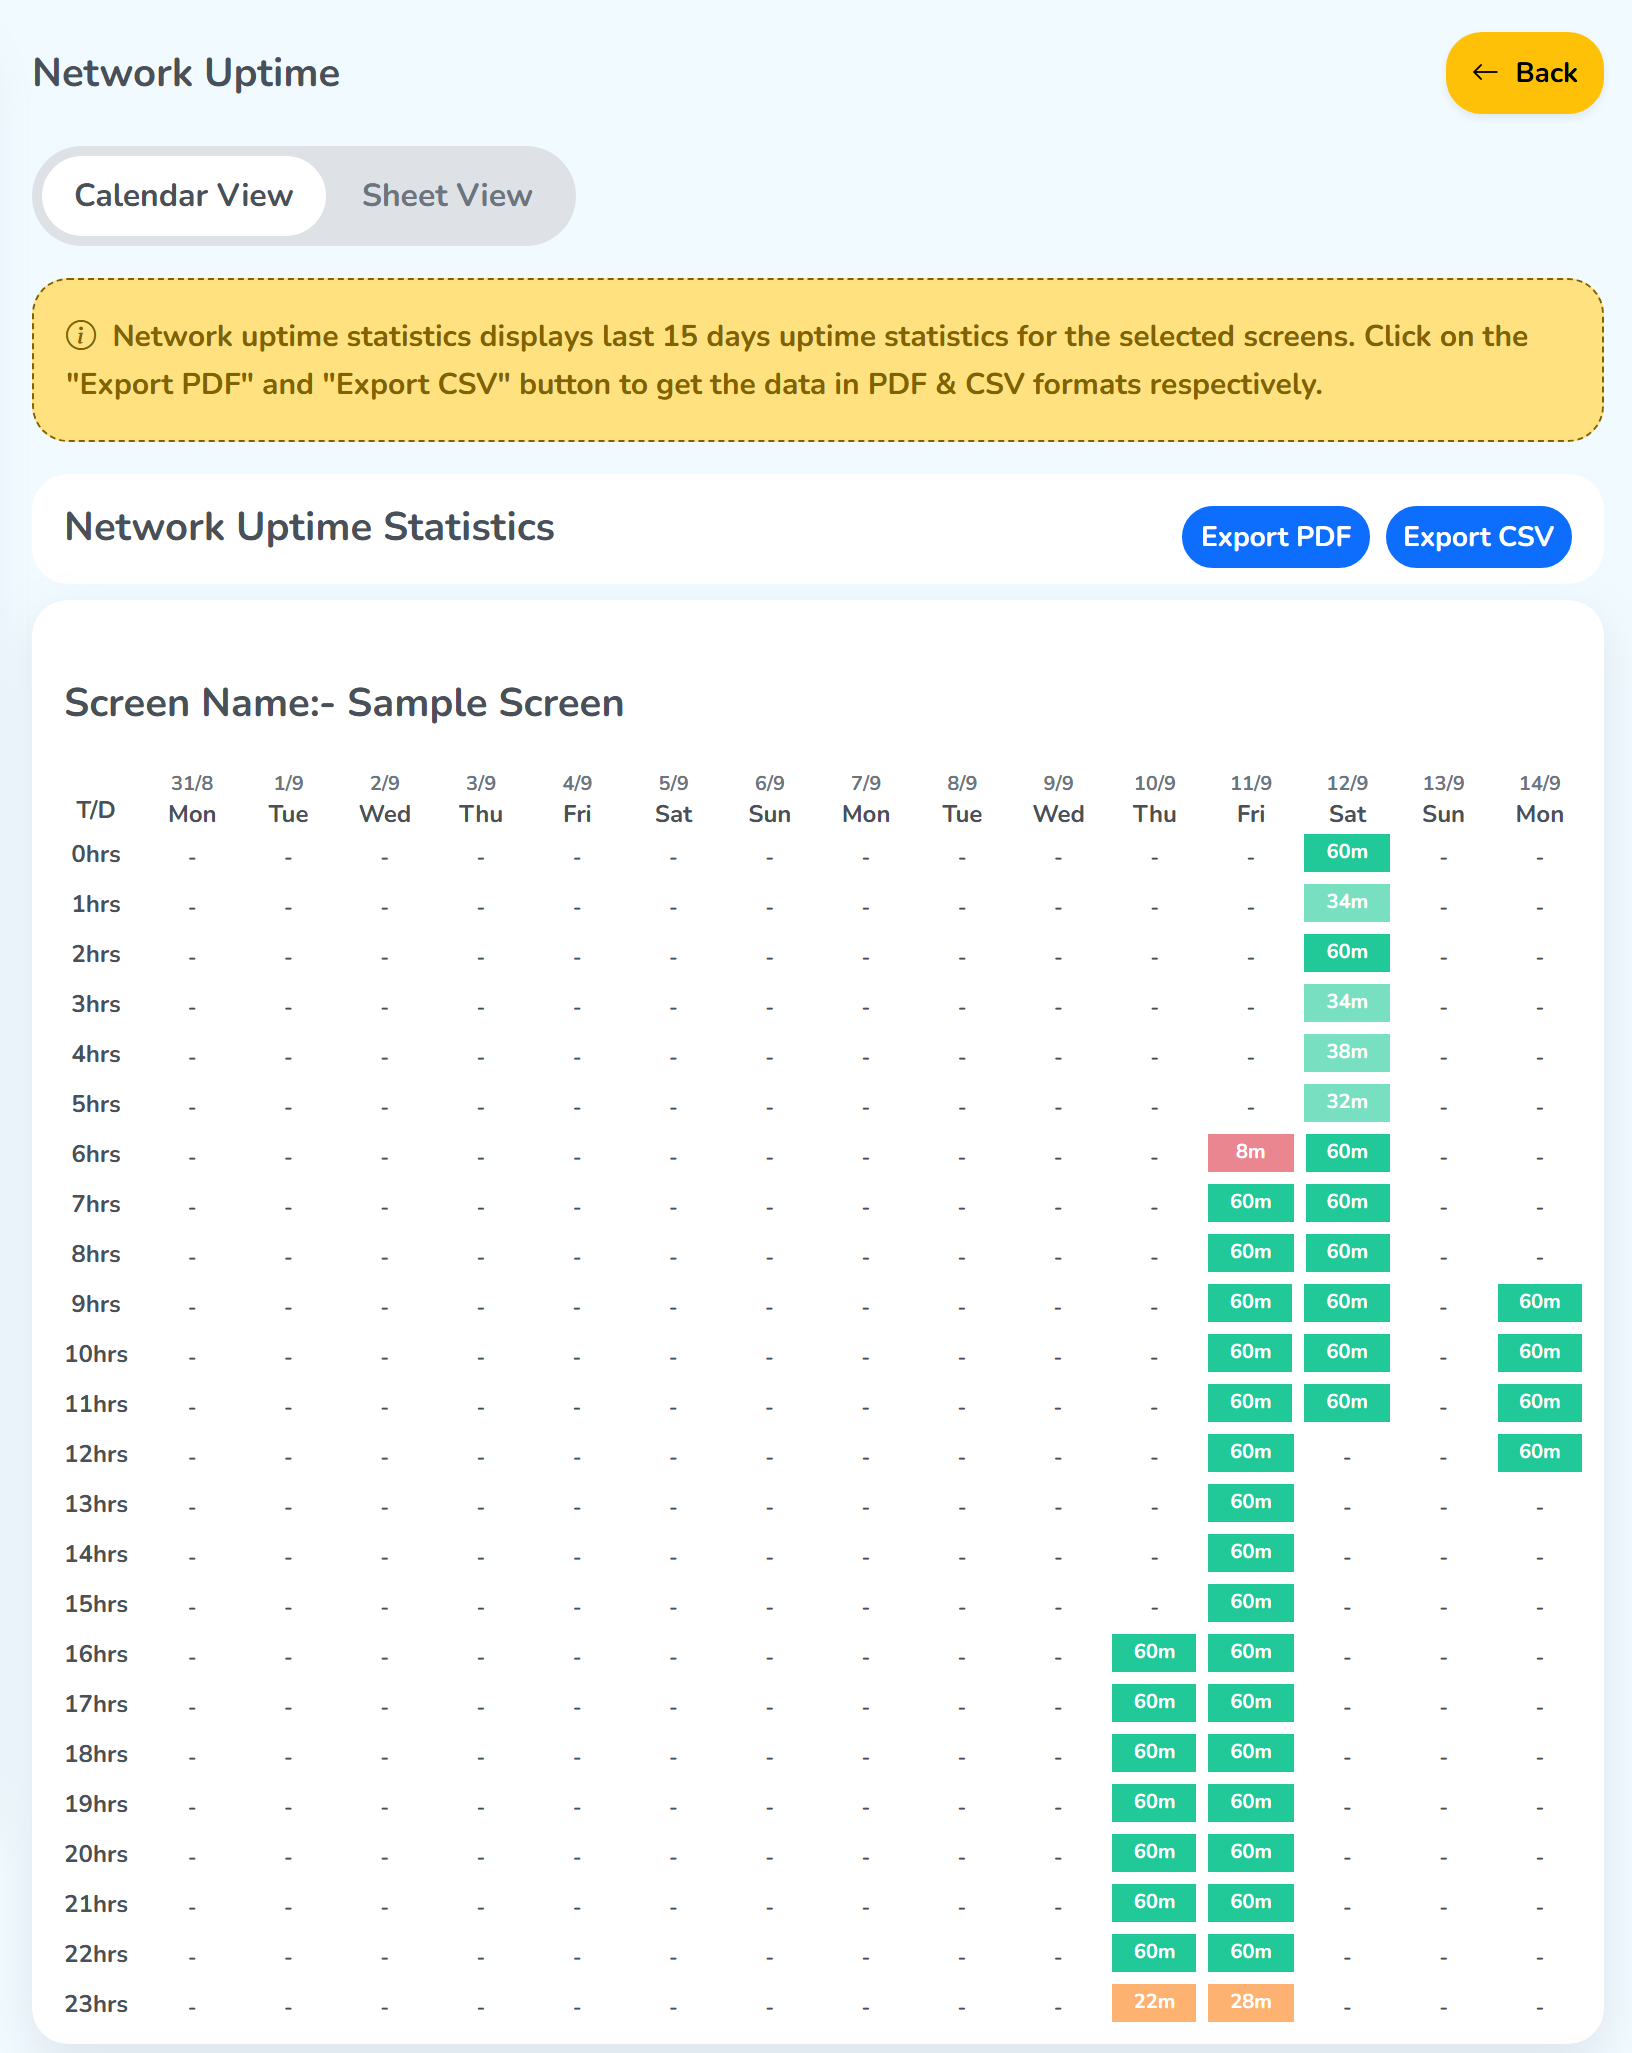 The same data as a calendar or a tableDownloads the dataHours down the side, dates across the top
Top tabs
- Calendar View: the uptime laid out by hour and date.
- Sheet View: the same data as a table.
Toolbar buttons
- Export PDF: downloads the data as a PDF.
- Export CSV: downloads the data as a CSV.
For one screen, see its Network Uptime tab.